
BMNRX was Pionex’s strongest stock-linked market in both categories for the completed week ending August 22, 2026. The spot pair gained 30.53%, while the separate perpetual contract gained 27.02%. That makes BMNRX the clear headline asset, but the more useful question is what the price path would have meant for a trading bot.
Using Pionex’s five-minute BMNRX perpetual candles, a disclosed $1,000 long Futures Grid simulation produced an estimated $48.30 net profit. A simple 1× long benchmark would have made far more because BMNRX broke above the grid’s ceiling and continued rising. This week’s lesson is not merely which tokenized stock won. It is how bot range selection changed the outcome.
Contents
- 1 Top tokenised stock assets this week at a glance
- 2 What is BMNRX on Pionex?
- 3 Why BMNRX moved during the week
- 4 BMNRX chart: the move that broke the grid
- 5 How the $1,000 Futures Grid simulation was calculated
- 6 Estimated result: $1,000 became $1,048.30
- 7 Why a simple 1× long benchmark made more
- 8 What the simulation teaches about Futures Grid settings
- 9 How to trade the two BMNRX markets on Pionex
- 10 What to watch next week
- 11 Frequently asked questions
Top tokenised stock assets this week at a glance
The reporting window is August 16, 2026 at 00:00 UTC through August 22, 2026 at 23:59 UTC. Returns use the first daily candle’s open and the final daily candle’s close. SPOT and PERP rankings are kept separate because they are different products.
Top 5 Pionex tokenized stock SPOT markets
| Rank | Market | Open | Close | Weekly return |
|---|---|---|---|---|
| 1 | BMNRX/USDT | 18.05 | 23.56 | +30.53% |
| 2 | CRCLX/USDT | 71.26 | 87.36 | +22.59% |
| 3 | TSLLX/USDT | 8.74 | 9.82 | +12.36% |
| 4 | COPXX/USDT | 86.00 | 94.67 | +10.08% |
| 5 | SLVX/USDT | 58.68 | 62.57 | +6.63% |
Top 5 Pionex stock-linked PERP markets
| Rank | Market | Open | Close | Weekly return |
|---|---|---|---|---|
| 1 | BMNRX/USDT perpetual | 17.99 | 22.85 | +27.02% |
| 2 | MSTRX/USDT perpetual | 94.43 | 119.85 | +26.92% |
| 3 | COINX/USDT perpetual | 149.26 | 184.98 | +23.93% |
| 4 | CRCLX/USDT perpetual | 71.33 | 87.50 | +22.67% |
| 5 | SOXSX/USDT perpetual | 40.40 | 47.80 | +18.32% |
Market data source: Pionex daily candles. Figures are rounded to two decimal places. Rankings cover verified stock-linked markets available in the checked Pionex universe and exclude ordinary crypto assets with similar ticker endings.
What is BMNRX on Pionex?
BMNRX gives you price exposure linked to BitMine Immersion Technologies, whose US stock ticker is BMNR. Pionex offers two distinct ways to trade the theme:
- BMNRX/USDT spot: an xStock trading pair. Pionex announced the BMNRX xStock listing and its BMNRX/USDT market.
- BMNRX/USDT perpetual: a USDT-margined derivatives contract. Pionex’s BMNRX perpetual listing notice states that leverage can reach 20×, although this article’s simulation uses only 1×.
These products should not be combined in one ranking. Spot and perpetual prices can differ because their market structure, liquidity, fees and financing are not identical. A perpetual also introduces funding and liquidation risk that does not apply in the same way to spot.
Why BMNRX moved during the week
The strongest identifiable company-specific catalyst arrived on August 17. BitMine reported that its ETH holdings had reached 5.82 million tokens and that its total crypto and cash holdings were $11.4 billion. The announcement appeared on BitMine’s investor-relations page.
That matters because BMNR has become closely watched as an Ethereum-treasury stock. When expectations around ETH holdings, treasury value or the company’s accumulation strategy change, demand for BMNR-linked instruments can react sharply. Pionex’s BMNRX markets also trade continuously, so weekend and off-hours pricing may keep moving even when the underlying US equity venue is closed.
Continuous access does not guarantee perfect tracking. Thin off-hours liquidity, wider spreads and changing expectations about the next US stock-market open can create temporary differences between the tokenized market and the underlying share.
BMNRX chart: the move that broke the grid
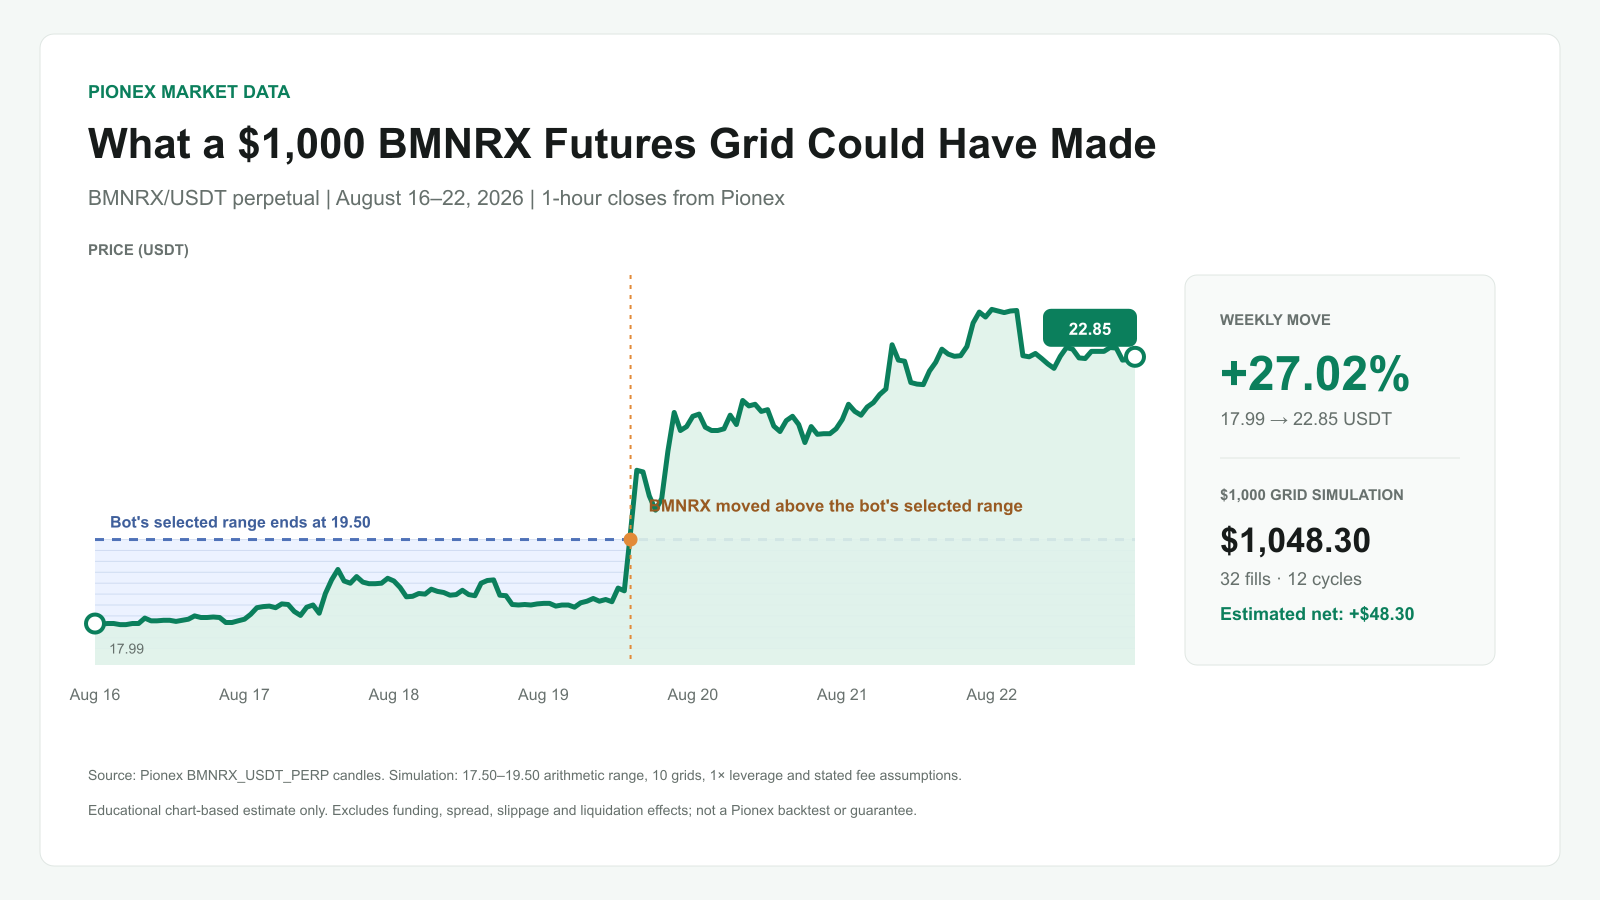
BMNRX opened the week at 17.99 USDT. The first part of the chart was relatively contained, with repeated movement around the high-17 and low-18 area. That is the section where a grid could repeatedly buy lower and sell one interval higher.
The structure changed on August 19. BMNRX crossed 19.50 USDT, accelerated above 20 USDT and eventually reached a weekly high of 23.85 USDT. It closed August 22 at 22.85 USDT. Once price remained above the grid ceiling, there were no higher grid levels left to trade.
How the $1,000 Futures Grid simulation was calculated
This is a chart-based educational model, not a claim taken from a running user bot. The settings and fill rules are disclosed so readers can understand exactly what the estimate represents.
| Starting capital | $1,000 |
|---|---|
| Direction | Long Futures Grid |
| Leverage | 1× |
| Start price | 17.99 USDT |
| Grid range | 17.50–19.50 USDT |
| Grid type | Arithmetic |
| Intervals | 10 |
| Distance per interval | 0.20 USDT |
| Notional per interval | Approximately $100 |
| Price data | Pionex five-minute BMNRX perpetual candles |
| Opening fee assumption | 0.05% taker fee on the initial long tranches |
| Grid-fill fee assumption | 0.02% maker fee per simulated fill |
Each interval was treated as an independent buy-sell pair. Levels above the start price began with a long tranche waiting to sell. Lower intervals waited for price to fall to their buy level. After a sell, the model placed the replacement buy one interval lower; after a buy, it placed the replacement sell one interval higher.
To avoid overstating activity inside a single candle, a replacement order could not fill until the next five-minute candle. A level counted as filled only when that candle’s high-low range crossed the order price.
Estimated result: $1,000 became $1,048.30
| Simulation result | Estimate |
|---|---|
| Total fills | 32 |
| Buy fills | 12 |
| Sell fills | 20 |
| Completed buy-sell grid cycles | 12 |
| Gross simulated profit | $49.36 |
| Stated simulated fees | $1.06 |
| Estimated net profit | $48.30 |
| Estimated ending value | $1,048.30 |
The model made money while BMNRX oscillated inside the range and while its initial long tranches were sold at progressively higher grid levels. However, the range was fully exhausted once BMNRX moved above 19.50 USDT.
This result should not be described as verified bot history. It is an estimate reconstructed from the chart. It excludes funding payments, spread, slippage, liquidation effects and taxes. A real bot can produce a different result because of order-book depth, execution timing, fee tier and configuration.
Why a simple 1× long benchmark made more
A $1,000 price-equivalent long opened at 17.99 USDT and closed at 22.85 USDT would have ended near $1,268.88 after applying a 0.05% fee at entry and another 0.05% fee at exit. That is an estimated profit of $268.88.
The gap is not evidence that a grid is always inferior. It shows that this week’s final market structure was a strong directional breakout. A fixed-range grid monetizes repeated movement inside its boundaries, but it gradually sells long exposure as price rises. Once the market leaves the range, you must decide whether to stop, expand or rebuild the bot. Changing the range retrospectively would turn the exercise into hindsight rather than a reproducible weekly test.
What the simulation teaches about Futures Grid settings
1. A range selected from recent prices can become obsolete quickly
The 17.50–19.50 range covered BMNRX’s recent trading area before the breakout. It was defensible at the start, but it could not anticipate the size of the August 19 move. A wider ceiling would have retained more long exposure, although it would also have increased grid spacing or required more capital.
2. More fills do not automatically mean more profit
The simulation recorded 32 fills, yet its return was far below the buy-and-hold benchmark. Fill count measures activity, not whether the bot remained positioned for the dominant trend.
3. Leverage would change the risk, not repair the range
Using 2×, 5× or 20× leverage could magnify gains and losses, increase liquidation sensitivity and change margin requirements. It would not solve the basic problem that the selected grid ended at 19.50 USDT. The educational model therefore stays at 1×.
4. Funding and tracking risk still matter
A perpetual position can pay or receive funding, while BMNRX may trade differently from the underlying BMNR share during off-hours. If you test the setup, check current funding, spread and contract specifications before placing a live bot.
How to trade the two BMNRX markets on Pionex
You can use BMNRX/USDT spot for xStock exposure. If you want to evaluate the derivatives strategy, open the BMNRX perpetual bot market.
For the product mechanics, read the Pionex Futures Grid guide. For the broader asset class, see the Pionex tokenized stocks guide and the explanation of tokenized-stock fees and spreads.
What to watch next week
- Whether 22.85 USDT becomes support: holding above the breakout zone would keep the weekly structure constructive; losing it could produce a deeper retracement.
- Whether BMNRX returns toward 19.50: that would bring the old range back into view, but it would also mean the breakout has weakened.
- BitMine’s next treasury update: BMNR-linked instruments can react to changes in reported ETH holdings, treasury value and financing plans.
- Spot-perpetual divergence: the two BMNRX products had different weekly returns. A widening gap may reflect liquidity, funding or off-hours pricing.
Frequently asked questions
What was Pionex’s top-performing tokenized stock spot market for the week ending August 22, 2026?
BMNRX/USDT ranked first in the separate spot list, rising 30.53% from 18.05 USDT to 23.56 USDT between August 16 and August 22, 2026.
What was Pionex’s top-performing stock-linked perpetual for the same week?
BMNRX/USDT perpetual ranked first in the separate perpetual list, rising 27.02% from 17.99 USDT to 22.85 USDT.
How much did the $1,000 BMNRX Futures Grid simulation make?
The chart-based simulation ended near $1,048.30, an estimated net profit of $48.30 after the stated entry and maker-fill fees.
How many fills did the simulated Futures Grid record?
The model recorded 32 fills: 12 buys and 20 sells. Twelve buy-sell grid cycles were completed before BMNRX moved above the selected range.
Why did the Futures Grid earn less than a simple long position?
The bot’s upper boundary was 19.50 USDT. BMNRX broke above that ceiling on August 19 and closed at 22.85 USDT, so the grid progressively sold its long tranches and did not capture most of the later upside.
Is this an official Pionex bot backtest?
No. It is an educational chart-based simulation using Pionex five-minute candles and disclosed rules. It is not an authenticated bot-history result, a Pionex backtest or a guarantee of future returns.
Can BMNRX spot and BMNRX perpetual be treated as the same product?
No. BMNRX spot is an xStock trading pair, while BMNRX perpetual is a USDT-margined derivatives contract. Their prices, fees, risks and weekly returns can differ.
What costs are excluded from the simulation?
The estimate excludes funding payments, spread, slippage, liquidation effects and any tax impact. Those costs can materially change a live result.
Risk disclosure: Tokenized stocks and stock-linked perpetual futures involve market, liquidity, tracking and product-structure risks. Perpetual futures also involve funding, margin and liquidation risk. Historical returns and chart-based simulations do not predict future performance. This article is for educational purposes and is not financial advice.
