
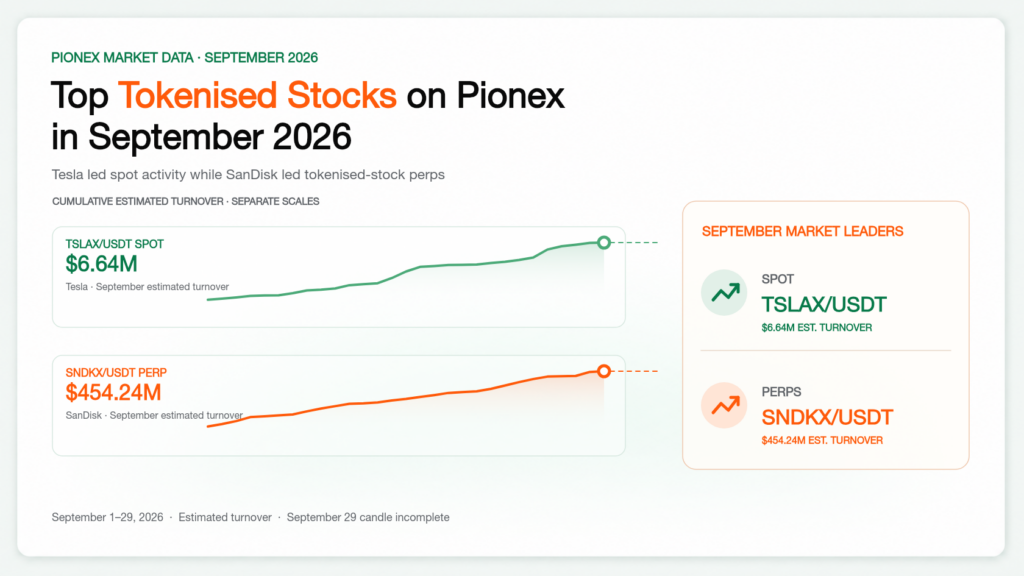
Tesla was Pionex’s most-traded tokenised-stock spot market in September, while SanDisk led the tokenised-stock perpetual ranking. TSLAX/USDT generated an estimated $6.64 million in spot turnover, and SNDKX/USDT Perp generated an estimated $454.24 million. The wider story was the concentration of perpetual activity in semiconductor, AI-infrastructure and leveraged-ETF markets, even though the largest trading volume did not always produce the strongest price return.
This report ranks Pionex tokenised stocks and ETFs by estimated USDT turnover from September 1 through September 29, 2026. Spot and perpetual markets are kept separate because they are different products. Spot tokens carry issuer, custody, tracking and liquidity risks. Perpetuals add funding, leverage, margin and liquidation risk.
If you are new to these products, read the Pionex tokenised stocks and xStocks guide before choosing a market.
Contents
- 1 September’s market leaders
- 2 Tesla stayed first in tokenised-stock spot trading
- 3 SanDisk led a semiconductor-heavy perp ranking
- 4 September extended the series, but changed the order
- 5 What the rankings mean when choosing a market or bot
- 6 Risks that matter before trading the September leaders
- 7 How the September ranking was calculated
- 8 Frequently asked questions
- 9 Disclaimer
September’s market leaders
| Category | Leading market | Market tracked | Estimated turnover | September change |
|---|---|---|---|---|
| Tokenised-stock spot | TSLAX/USDT | Tesla | $6.64M | -2.32% |
| Tokenised-stock perp | SNDKX/USDT Perp | SanDisk | $454.24M | +11.90% |
Tesla led the spot list despite falling 2.32% during the reporting window. SanDisk combined the highest estimated perp turnover with an 11.90% rise. That difference is useful: turnover measures where traders were active, while price change measures direction. Neither is a recommendation or a measure of investment quality.
Tesla stayed first in tokenised-stock spot trading
The spot ranking covers tokenised stocks and ETF-linked tokens quoted in USDT. These products provide price exposure through a token structure. They are not ordinary brokerage shares and do not automatically provide shareholder voting or transfer rights.
| Rank | Pionex spot market | Market tracked | Estimated turnover | September change |
|---|---|---|---|---|
| 1 | TSLAX/USDT | Tesla | $6.64M | -2.32% |
| 2 | CRCLX/USDT | Circle | $4.51M | -8.71% |
| 3 | GOOGLX/USDT | Alphabet | $3.41M | +0.88% |
| 4 | METAX/USDT | Meta | $3.01M | +25.39% |
| 5 | BMNRX/USDT | BitMine | $2.97M | +9.64% |
| 6 | NVDAX/USDT | NVIDIA | $2.96M | +4.52% |
| 7 | AAPLX/USDT | Apple | $2.59M | +6.50% |
| 8 | SLVX/USDT | iShares Silver Trust ETF | $1.95M | -8.56% |
| 9 | USOX/USDT | United States Oil Fund ETF | $1.72M | +11.90% |
| 10 | AMZNX/USDT | Amazon | $1.69M | -5.23% |
Source: Pionex daily market candles from September 1 at 00:00 UTC through September 29, 2026, retrieved at 07:34 UTC. The September 29 candle was incomplete.
TSLAX finished first by activity, but it was not the best performer in the table. METAX gained 25.39%, while TSLAX, CRCLX, SLVX and AMZNX declined. A busy market can attract buyers and sellers at the same time, so high turnover should not be read as bullish confirmation.
Meta’s move was the most notable shift inside the spot Top 10. METAX rose from seventh in the August activity ranking to fourth in September. Meta announced a $0.525 quarterly dividend on September 10, payable on September 28 to shareholders of record on September 21. The announcement was one company event traders could monitor, but this ranking does not prove that the dividend caused the token’s full 25.39% move.
SanDisk led a semiconductor-heavy perp ranking
Perpetual markets are contracts rather than spot tokens. They can be traded long or short, have no fixed expiry, and use funding payments to help keep contract prices near their reference markets. The selected leverage, funding rate and liquidation price can materially change a trader’s result.
| Rank | Pionex perpetual market | Market tracked | Estimated turnover | September change |
|---|---|---|---|---|
| 1 | SNDKX/USDT Perp | SanDisk | $454.24M | +11.90% |
| 2 | SOXLX/USDT Perp | Direxion Semiconductor Bull 3X ETF | $368.48M | +27.69% |
| 3 | MSTRX/USDT Perp | Strategy | $254.72M | +21.13% |
| 4 | MUX/USDT Perp | Micron Technology | $231.51M | +12.34% |
| 5 | SPCX/USDT Perp | SpaceX | $192.62M | +2.31% |
| 6 | SKHX/USDT Perp | SK Hynix | $141.48M | +6.98% |
| 7 | CRCLX/USDT Perp | Circle | $87.59M | -8.77% |
| 8 | QQQX/USDT Perp | Invesco QQQ ETF | $78.62M | +2.94% |
| 9 | GOOGLX/USDT Perp | Alphabet | $69.32M | +0.88% |
| 10 | NVDAX/USDT Perp | NVIDIA | $69.12M | +4.57% |
Source: Pionex daily market candles from September 1 at 00:00 UTC through September 29, 2026, retrieved at 07:34 UTC. Returns exclude a trader’s selected leverage, funding, fees, slippage and liquidation.
SNDKX remained the activity leader after also ranking first in August. SOXLX moved from fourth to second, while MSTRX rose from sixth to third. MUX and SPCX stayed highly active but moved down to fourth and fifth.
The mix shows how strongly traders focused on memory, semiconductors and AI infrastructure. SanDisk participated in two investor conferences on September 8 and 9 after presenting its longer-term growth strategy in August. Micron announced a new ultra-dense server memory module on September 15 and scheduled its fiscal fourth-quarter results for September 30. Those events gave traders fresh company information to assess, but they do not prove why every SNDKX or MUX trade occurred.
SOXLX needs an extra layer of caution. It tracks an ETF designed to deliver three times the daily performance of a semiconductor index. Trading a perpetual linked to a daily leveraged ETF can add contract leverage, funding and liquidation risk on top of an already leveraged reference product. Its 27.69% September rise was the strongest return inside the perp Top 10, but it was also one of the more complex products in the ranking.
September extended the series, but changed the order
The August market episode also placed TSLAX first in spot and SNDKX first in perps. September therefore did not replace the two leaders. It changed the activity beneath them.
MSTRX’s estimated turnover increased from $104.04 million in August to $254.72 million through September 29. SOXLX increased from an estimated $327.96 million to $368.48 million. By contrast, MUX and SPCX remained large markets but recorded less estimated turnover than in the August report.
The spot list was more stable. Tesla remained first, Circle remained near the top, and the largest upward move in the ranking came from Meta. NVIDIA slipped from second in August to sixth in September even though NVDAX still gained 4.52%.
Earlier monthly editions show how quickly the leaders can change:
- June 2026 tokenised-stock ranking
- July 2026 tokenised-stock ranking
- August 2026 spot and perp ranking
The weekly reports add another lesson. BMNRX led both spot and perps during August 16 to 22, while SNXXX led the preceding weekly perp performance table. Neither market led September’s full month-to-date activity ranking. A one-week price winner and a monthly turnover leader answer different questions.
What the rankings mean when choosing a market or bot
The rankings are most useful as a starting point for checking liquidity, spreads and product structure. They are not a list of markets to buy.
| If you want to… | Product to examine | Check first | Main risk |
|---|---|---|---|
| Trade the supported token without futures leverage | Tokenised-stock spot | Spread, session, issuer, custody and tracking | Price decline, tracking drift and liquidity |
| Trade long or short | Tokenised-stock perp | Funding, leverage, mark price and liquidation price | Amplified loss and liquidation |
| Trade repeated movement inside a range | Spot Grid or Futures Grid | Range, grid count and what happens outside the range | Price can leave the range |
| Build an entry gradually | Spot DCA or Futures DCA | Total planned capital and every staged order | Adding during a decline increases exposure |
TSLAX’s negative return alongside the highest spot turnover is a reminder that Spot Grid settings need more than a popular ticker. A grid can complete trades while price oscillates, but the token can still finish lower or fall below the grid range.
SNDKX’s 11.90% rise and high perp turnover may make Futures Grid or Futures DCA relevant to some experienced traders, but direction, range and leverage must match the trader’s actual view. Funding can reduce returns, and a company announcement can push price outside a carefully selected range.
If you are deciding between Spot Grid, DCA and a futures bot, use the Pionex Trading Bot Finder. It narrows the choices based on experience, market view, risk and time. The result is guidance, not a prediction. Pionex calculates the exact minimum investment from the pair and settings and shows it before confirmation.
⚠️ A trading bot follows its rules. It does not know whether earnings, regulation, funding, liquidity or a sudden market gap has changed the reason for the trade.
Risks that matter before trading the September leaders
High turnover can hide a falling market
TSLAX and CRCLX ranked first and second in spot turnover while both declined. High activity can reflect disagreement, hedging or rapid exits. Check the live order book and spread instead of assuming the monthly leader is easier or safer to trade at every moment.
The token or contract is not an ordinary share
A spot token depends on its issuer, custodian, liquidity and tracking structure. A perpetual is a derivative and does not provide ownership or voting rights. Review the exact market’s rules, trading session and regional availability before funding an order.
Funding and leverage can reverse the apparent result
The percentage changes in the perp table describe contract prices before leverage, funding, fees and slippage. A leveraged position can lose more quickly than the unleveraged percentage suggests. A profitable price direction can also produce a weaker account result after funding and execution costs.
Leveraged ETFs can compound product complexity
SOXLX follows a daily leveraged ETF, and QQQX follows an ETF rather than one company. Daily-reset leverage can behave differently over several sessions from a simple three-times monthly return. Adding perpetual leverage on top requires careful position sizing and liquidation planning.
September is not finished
The scan was retrieved on September 29 at 07:34 UTC, while the day’s candle was still open. The final September order and totals can change after the remaining session and the September 30 candle are included. Treat this as a month-to-date report, not a completed month-end record.
How the September ranking was calculated
The scan covered 309 USDT spot markets and 561 USDT perpetual markets. Ordinary crypto assets with stock-like ticker endings, including AVAX, TRX, STX, SNX, GMX and ZRX, were excluded from the tokenised-stock lists.
Pionex daily candles report base-asset volume. For each candle, estimated USDT turnover was calculated as:
Base volume × ((open + high + low + close) ÷ 4)
The daily estimates were then added from September 1 through the latest September 29 candle. The method gives a consistent measure for ranking activity, but it is not audited exchange volume, account revenue or proof of executable liquidity at a specific order size. Price change was calculated from the September 1 opening price to the latest available September 29 close.
The market data came from Pionex’s public ticker and daily-candle endpoints. Exact market availability was checked separately for every Top 10 symbol.
Frequently asked questions
What was Pionex’s most-traded tokenised-stock spot market in September 2026?
TSLAX/USDT, which tracks Tesla, ranked first with an estimated $6.64 million in turnover from September 1 through September 29, 2026. It fell 2.32% during the same reporting window, showing that the most active market was not the strongest performer.
What was Pionex’s most-traded tokenised-stock perp in September 2026?
SNDKX/USDT Perp, which tracks SanDisk, ranked first with an estimated $454.24 million in turnover. The contract rose 11.90% before a trader’s leverage, funding, fees and slippage.
Were these the biggest September gainers on Pionex?
No. The tables rank estimated trading activity, not the largest price gains. METAX had the strongest return inside the spot Top 10 at 25.39%, while SOXLX had the strongest return inside the perp Top 10 at 27.69%.
Why are ETFs included in a tokenised-stock ranking?
Pionex’s broader xStocks market group includes supported stock, ETF and other stock-linked products. This report names the market tracked so readers can distinguish a company token such as TSLAX from an ETF-linked product such as SLVX, USOX, SOXLX or QQQX.
Disclaimer
This article is for informational purposes only and does not constitute financial or investment advice. Crypto trading carries significant risk including total loss of capital. Past performance is not indicative of future results. Always conduct your own research before trading.
Data source: Pionex public market API, retrieved September 29, 2026 at 07:34 UTC. Company context was checked against official Sandisk, Micron and Meta investor-relations releases. September 29 data was incomplete.
