
Pionex Market Data | August 31, 2026
If you opened Pionex in August expecting Bitcoin, Ether and Solana to dominate, you were mostly right. BTC led both spot and perpetual trading. But the surprise came further down the perpetual ranking: SNDKX, MUX, SPCX and SOXLX all entered the Top 10 by estimated turnover. Here is what led each market category, which assets gained the most, and what those rankings mean before you choose a market or trading bot.
Contents
- 1 August’s market leaders
- 2 Tokenised stock spot: TSLAX led trading
- 3 Tokenised stock perps: SNDKX entered a crypto-dominated ranking
- 4 Overall perps: BTC dominated activity
- 5 Crypto spot: BTC led, but smaller markets moved more
- 6 Most traded does not mean biggest gainer
- 7 What the rankings mean when choosing a Pionex bot
- 8 Risks and limitations
- 9 How to find and trade tokenised stocks on Pionex
- 10 How to monitor these markets on Pionex
- 11 How the rankings were calculated
- 12 Disclaimer
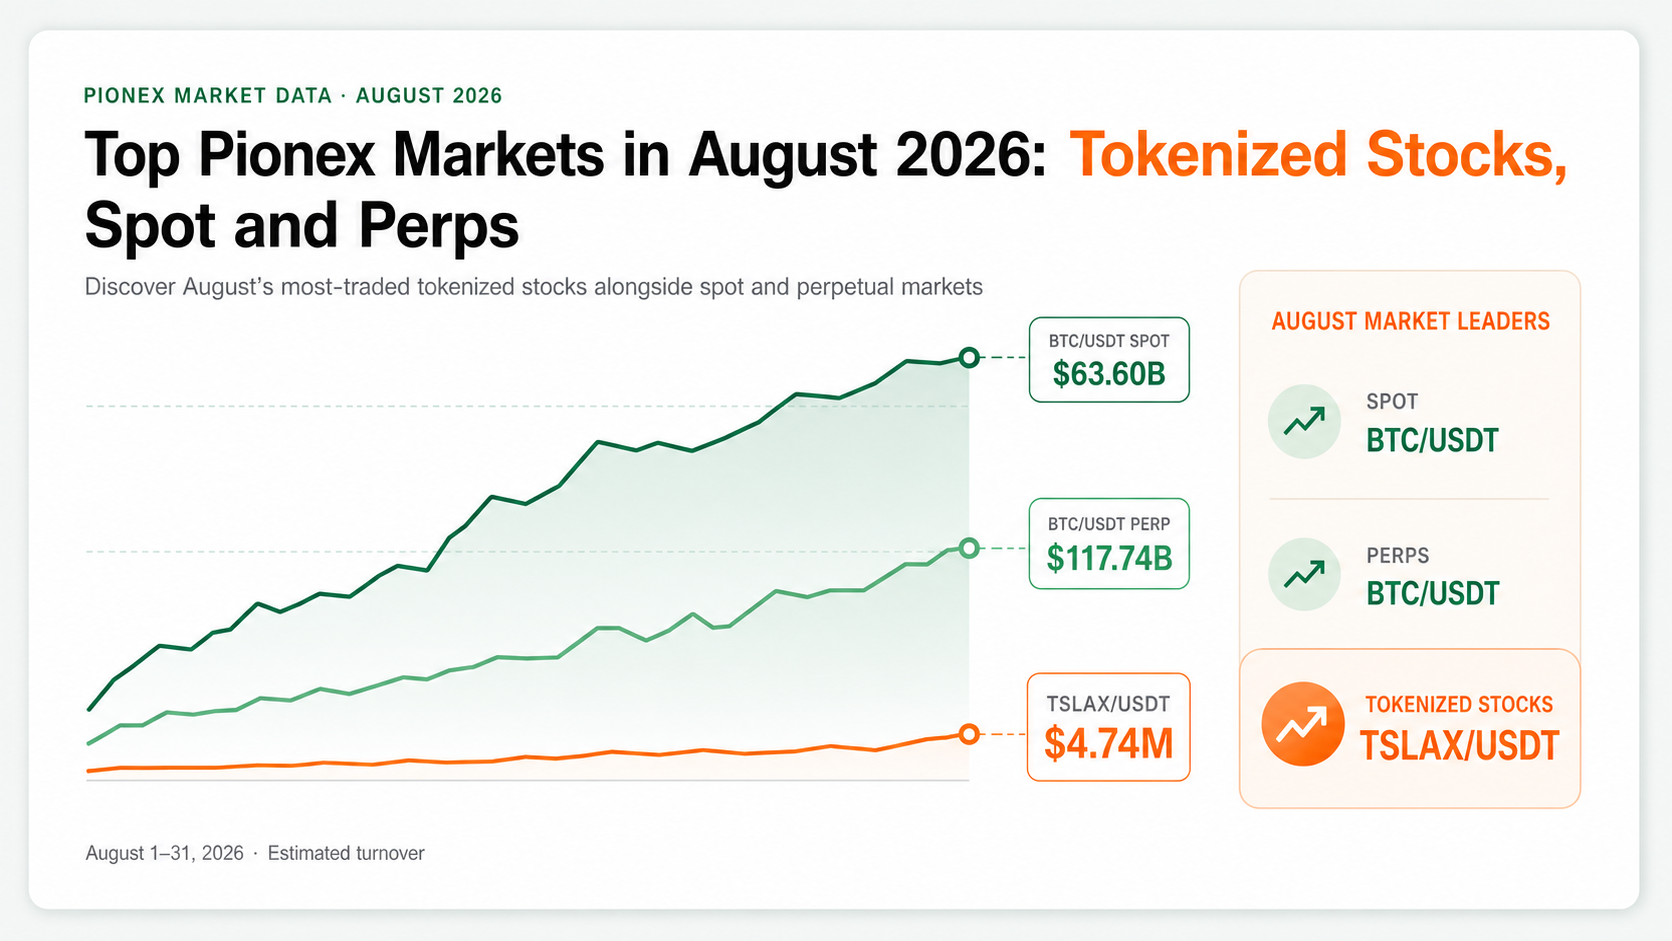
August’s market leaders
| Category | Leading market | Estimated turnover | August price change |
|---|---|---|---|
| Tokenised stock spot | TSLAX/USDT | $4.74 million | +12.26% |
| Tokenised stock perp | SNDKX/USDT Perp | $678.53 million | +23.60% |
| All USDT perpetuals | BTC/USDT Perp | $117.74 billion | +25.23% |
| All USDT spot markets | BTC/USDT | $63.60 billion | +25.23% |
Bitcoin dominated the broad crypto markets. TSLAX led tokenised stock spot, while SNDKX led tokenised stock perps. Turnover shows where traders were active. Price change shows which markets moved most.
Tokenised stock spot: TSLAX led trading
These are tokenised stocks and ETFs traded on spot. They are ranked separately because spot markets and perps work differently and carry different risks.
| Rank | Pionex spot market | Market tracked | August price range | Estimated turnover | August change |
|---|---|---|---|---|---|
| 1 | TSLAX/USDT | Tesla | 309.79 to 347.78 USDT | $4.74M | +12.26% |
| 2 | NVDAX/USDT | NVIDIA | 199.23 to 219.18 USDT | $4.70M | +10.01% |
| 3 | CRCLX/USDT | Circle | 61.50 to 87.92 USDT | $4.44M | +42.96% |
| 4 | GOOGLX/USDT | Alphabet | 354.56 to 344.86 USDT | $4.41M | -2.74% |
| 5 | BMNRX/USDT | BitMine | 17.08 to 24.11 USDT | $2.83M | +41.16% |
| 6 | AAPLX/USDT | Apple | 307.66 to 319.53 USDT | $2.75M | +3.86% |
| 7 | METAX/USDT | Meta | 554.32 to 575.44 USDT | $2.51M | +3.81% |
| 8 | SLVX/USDT | iShares Silver Trust | 52.21 to 60.54 USDT | $2.10M | +15.95% |
| 9 | AMZNX/USDT | Amazon | 270.59 to 265.06 USDT | $1.98M | -2.04% |
| 10 | USOX/USDT | United States Oil Fund | 133.57 to 134.29 USDT | $1.90M | +0.54% |
Source: Pionex daily market candles for August 1 through August 31, 2026, retrieved August 31, 2026 at 09:09 UTC. August 31 was incomplete. Returns measure the first candle’s opening price against the latest available close.
TSLAX led by estimated turnover, but CRCLX and BMNRX delivered the larger price moves. That distinction matters. Turnover measures activity, while return measures direction. Neither tells you that an asset is suitable for your risk level.
Circle’s August 5 results gave CRCLX traders a company-specific event to monitor during the month. Circle’s official release also listed competition, stablecoin demand, regulation and the planned Arc network among its material uncertainties. BMNRX, meanwhile, remained connected to the crypto-treasury and mining narrative that drove its earlier volatility.
Pionex explains that its tokenised stock markets aggregate liquidity from providers such as xStocks and Ondo Stocks. These products are designed to track stock or ETF prices, but they are not the same as holding ordinary shares through a broker. Read the Pionex tokenised stocks and xStocks guide before treating the ticker as proof of voting, dividend or custody rights.
Tokenised stock perps: SNDKX entered a crypto-dominated ranking
This ranking covers tokenised stock and ETF perps, not spot markets. Because they are perpetual futures, traders also need to account for funding, margin and liquidation risk.
| Rank | Pionex perpetual | Market tracked | Estimated turnover | August change |
|---|---|---|---|---|
| 1 | SNDKX/USDT Perp | SanDisk | $678.53M | +23.60% |
| 2 | MUX/USDT Perp | Micron Technology | $366.78M | +14.59% |
| 3 | SPCX/USDT Perp | SpaceX | $363.86M | +30.29% |
| 4 | SOXLX/USDT Perp | Direxion Semiconductor Bull 3X ETF | $327.96M | +0.43% |
| 5 | SKHX/USDT Perp | SK Hynix | $318.16M | +11.92% |
| 6 | MSTRX/USDT Perp | Strategy | $104.04M | +40.74% |
| 7 | QQQX/USDT Perp | Invesco QQQ ETF | $104.04M | +4.53% |
| 8 | TSMX/USDT Perp | Taiwan Semiconductor | $87.24M | +3.64% |
| 9 | NVDAX/USDT Perp | NVIDIA | $76.28M | +9.96% |
| 10 | SNXXX/USDT Perp | Tradr 2X Long SNDK Daily ETF | $72.94M | +42.86% |
SNDKX was the most-traded tokenised stock perp in August. SNXXX gained the most within this turnover Top 10, while PLTRX topped the broader tokenised stock perp gainer table below. This is why activity and price performance are ranked separately.
Overall perps: BTC dominated activity
The overall perps ranking had one clear surprise: four of the ten highest-turnover markets were tokenised stock perps.
| Rank | Pionex perpetual | Market tracked | August price range | Estimated turnover | August change |
|---|---|---|---|---|---|
| 1 | BTC/USDT Perp | Bitcoin | 62,859.80 to 78,718.00 USDT | $117.74B | +25.23% |
| 2 | ETH/USDT Perp | Ethereum | 1,861.60 to 2,449.87 USDT | $90.06B | +31.60% |
| 3 | SOL/USDT Perp | Solana | 72.84 to 103.25 USDT | $24.60B | +41.76% |
| 4 | SNDKX/USDT Perp | SanDisk | 1,208.37 to 1,493.52 USDT | $678.53M | +23.60% |
| 5 | XRP/USDT Perp | XRP | 1.0612 to 1.3757 USDT | $460.52M | +29.64% |
| 6 | HYPE/USDT Perp | Hyperliquid | 52.55 to 81.46 USDT | $400.12M | +55.03% |
| 7 | ADA/USDT Perp | Cardano | 0.1681 to 0.1969 USDT | $376.62M | +17.13% |
| 8 | MUX/USDT Perp | Micron Technology | 814.14 to 932.95 USDT | $366.78M | +14.59% |
| 9 | SPCX/USDT Perp | SpaceX | 107.97 to 140.67 USDT | $363.86M | +30.29% |
| 10 | SOXLX/USDT Perp | Direxion Semiconductor Bull 3X ETF | 113.02 to 113.51 USDT | $327.96M | +0.43% |
Source: Pionex daily market candles for August 1 through August 31, 2026, retrieved August 31, 2026 at 09:09 UTC. August 31 was incomplete. Contract returns exclude selected leverage, funding, fees, slippage and liquidation.
SNDKX, MUX, SPCX and SOXLX generated a combined estimated $1.74 billion in turnover during the measured window. That still sits far below BTC, ETH and SOL, but it shows that tokenised stock perps drew meaningful activity in August.
Open the SNDKX Futures Grid market on Pionex
Why SNDKX attracted attention
SanDisk held its 2026 Investor Day on August 13. The company connected its growth plans to AI-related demand for higher performance, lower power consumption and greater storage density. SNDKX rose 23.60% during the Pionex reporting window and ranked fourth by estimated perpetual turnover.
The ranking does not prove that Investor Day caused every trade. It does show that SanDisk had both a live company catalyst and unusually high activity on Pionex during the same month. For the longer company and market background, read the SanDisk SNDKX analysis.
Why memory and semiconductor exposure mattered
MUX tracks Micron Technology, while SOXLX tracks a leveraged semiconductor ETF. Micron’s investor materials describe AI data-center expansion as a driver of demand for high-bandwidth memory and higher-capacity storage. SanDisk and SK Hynix were also among Pionex’s most active tokenised stock perps in August.
This was not one clean semiconductor trade. SOXLX finished almost flat at +0.43%, while SNDKX gained 23.60% and MUX gained 14.59%. The difference is a useful warning against treating all AI or chip-related products as interchangeable.
SPCX combined company news with futures risk
SPCX gained 30.29% during the measured window. SpaceX released its first public-company results in early August, while launch activity, Starlink growth and share-supply concerns kept the company in the news.
SPCX is a perpetual contract, not a SpaceX share in a Pionex spot wallet. A trader must monitor funding, leverage and liquidation alongside the company story. Read what was driving SPCX in August before using a headline as a directional signal.
Crypto spot: BTC led, but smaller markets moved more
| Rank | Pionex spot market | Asset | August price range | Estimated turnover | August change |
|---|---|---|---|---|---|
| 1 | BTC/USDT | Bitcoin | 62,887.88 to 78,757.01 USDT | $63.60B | +25.23% |
| 2 | ETH/USDT | Ethereum | 1,862.39 to 2,451.25 USDT | $14.98B | +31.62% |
| 3 | DOGE/USDT | Dogecoin | 0.06962 to 0.08308 USDT | $1.98B | +19.33% |
| 4 | SOL/USDT | Solana | 72.86 to 103.36 USDT | $1.11B | +41.86% |
| 5 | ADA/USDT | Cardano | 0.1682 to 0.1971 USDT | $471.36M | +17.18% |
| 6 | XRP/USDT | XRP | 1.0619 to 1.3768 USDT | $458.01M | +29.65% |
| 7 | ZEC/USDT | Zcash | 457.68 to 833.38 USDT | $359.85M | +82.09% |
| 8 | ACE/USDT | Fusionist | 0.0670 to 0.1738 USDT | $320.11M | +159.40% |
| 9 | BICO/USDT | Biconomy | 0.0117 to 0.0219 USDT | $299.92M | +87.18% |
| 10 | DEXE/USDT | DeXe | 2.6080 to 2.1320 USDT | $294.12M | -18.25% |
Source: Pionex daily market candles for August 1 through August 31, 2026, retrieved August 31, 2026 at 09:09 UTC. August 31 was incomplete.
BTC and ETH dominated turnover, but the largest percentage moves came from smaller markets. ACE gained 159.40%, BICO gained 87.18% and ZEC gained 82.09%. DEXE still ranked tenth by estimated activity even though its measured price fell 18.25%.
This is why “most traded” and “top performing” should not be used as synonyms. A heavily traded market can fall, and a large percentage gain can occur in a smaller or more volatile market.
Most traded does not mean biggest gainer
A busy market is not always the market with the largest price move. To avoid ranking extremely thin markets as August’s biggest gainers, this table includes only markets with all 31 daily candles and at least $1 million in estimated turnover.
| Category | Leading gainer | August change | Estimated turnover |
|---|---|---|---|
| Crypto spot | PROM/USDT | +266.87% | $28.70M |
| USDT perpetual | BTR/USDT Perp | +376.90% | $81.18M |
| Tokenised stock spot | CRCLX/USDT | +42.96% | $4.44M |
| Tokenised stock perp | PLTRX/USDT Perp | +49.55% | $23.48M |
PROM and BTR led the filtered crypto categories. CRCLX and PLTRX led the tokenised stock categories. These are backward-looking price moves, not forecasts or recommendations.
What the rankings mean when choosing a Pionex bot
The leaderboard only becomes useful when it helps you choose the correct product.
| If you want to… | Product to examine | What to check first | Main risk |
|---|---|---|---|
| Hold or trade a crypto asset without futures leverage | Spot | Liquidity, spread, entry plan and custody | The asset price can still fall sharply |
| Trade tokenised stocks or ETFs | Tokenised stock spot | Issuer, custody, eligibility, tracking and trading hours | Tracking drift, liquidity and issuer or custodian risk |
| Trade long or short with leverage | USDT perpetual | Direction, leverage, funding and liquidation price | Amplified losses and liquidation |
| Automate movement inside a range | Spot Grid or Futures Grid | Range, grid count, fees and what happens outside the range | The market can leave the selected range |
| Build a position gradually | Spot DCA or Futures DCA | Total planned capital and every staged order | Adding during a decline can increase exposure |
If you are unsure, use the Pionex Trading Bot Finder. It asks about your experience, market view, risk level and time before narrowing the available bots. The result is guidance, not a prediction.
Spot Grid for range-bound spot markets
Spot Grid buys and sells the actual supported spot asset inside a selected range. It does not create futures liquidation risk, but it can still lose money when price falls or remains outside the range. Check the live app for the exact minimum investment because it changes with the pair, range and number of grids.
Futures Grid for a defined long, short or neutral view
Futures Grid combines grid orders with a perpetual position. It may suit repeated movement inside a range, but leverage, funding and liquidation make it a higher-risk product. A narrow grid around an asset such as SNDKX or SPCX can stop placing useful trades if company news pushes price beyond the range.
DCA for staged entries
DCA spreads entries across multiple orders. That can reduce the risk of committing the full amount at one price, but it does not protect you from a sustained decline. Futures DCA can also increase liquidation risk as the position grows.
⚠️ A bot follows its settings. It does not know whether an earnings release, regulatory decision, launch failure or market reversal has changed the reason for the trade.
Risks and limitations
High activity does not mean low risk
SNDKX ranked above XRP in the perpetual table by estimated August turnover. That does not make SNDKX safer, more liquid at every moment or more suitable for a bot. Check the live order book, bid-ask spread and position size before trading.
Tokenised stock products are not ordinary shares
Tokenised stock spot products depend on issuer, custody and tracking arrangements. Tokenised stock perps add funding, margin and liquidation. Neither product automatically gives you the legal rights of a shareholder.
August 31 was incomplete
The ranking was retrieved at 09:09 UTC. Prices and activity later on August 31 could change the final order, especially where estimated turnover was close, such as TSLAX, NVDAX, CRCLX and GOOGLX.
How to find and trade tokenised stocks on Pionex
- Open Markets and search the exact symbol, such as TSLAX, SNDKX or SPCX.
- Confirm whether the result is SPOT or PERP before opening its order or bot screen.
- Check regional eligibility, trading hours, spread, liquidity and the live fee shown for that product.
- If you want automation, confirm that Spot Grid, Futures Grid or DCA is available for the exact market before funding the bot.
Pionex’s tokenised stock fee guide, checked August 20, 2026, lists tokenised stock spot fills at 0.1% each. It lists standard tokenised stock perp maker and taker fees at 0.02% and 0.05%, plus variable funding. Confirm the current rate in your account because fees and availability can change.
How to monitor these markets on Pionex
For spot markets, watch the latest price, spread, order-book depth and whether price remains inside any active Grid Bot range. For tokenised stocks, also check the underlying company’s calendar and whether the reference equity market is open.
For perpetuals, add the funding rate, funding countdown, selected leverage, available margin, mark price and liquidation price. Track grid profit separately from total P&L because a Futures Grid can record completed grid trades while the open position is losing money.
For tokenised stock products, monitor earnings, investor presentations, regulatory filings and product announcements from the underlying company. For crypto markets, monitor liquidity, network events and broader market direction rather than relying on one percentage move.
How the rankings were calculated
The scan covered 308 USDT spot markets and 561 USDT perpetual markets from August 1, 2026 at 00:00 UTC to August 31, 2026 at 09:09 UTC. KORUX/USDT Perp had no usable August candle and was excluded. Because the August 31 candle was still open, this is a month-to-date snapshot rather than a completed month-end report.
Pionex daily candles provide base-asset volume. To compare markets quoted in USDT, each day’s base volume was multiplied by that candle’s typical price, calculated from its open, high, low and close. The daily estimates were then added across the reporting window. These figures are useful for relative ranking, but they are estimates rather than audited exchange volume or Pionex account revenue.
Disclaimer
This article is for informational purposes only and does not constitute financial or investment advice. Crypto trading carries significant risk including total loss of capital. Past performance is not indicative of future results. Always conduct your own research before trading.
