Contents
Abstract
- The United States is highly unlikely to default on its debt, but speculation and concerns about short-term default can still cause significant volatility in the financial markets, creating short-term liquidity concerns for the cryptocurrency market while favoring decentralized finance in the long run.
- The sale of ETH by the Ethereum Foundation does not have a substantial impact on its price trend but may indicate a potential short-term weakness.
- We believe that the sustainability of BRC-20 popularity is questionable, but if there is impressive technological use cases, it will have long-term benefits for Bitcoin.
- We recommend establishing positions in Bitcoin within the price range of $24,000 to $26,000 and investing in Ethereum within the range of $1,600 to $1,700.
Macro Environment Analysis – US Debt
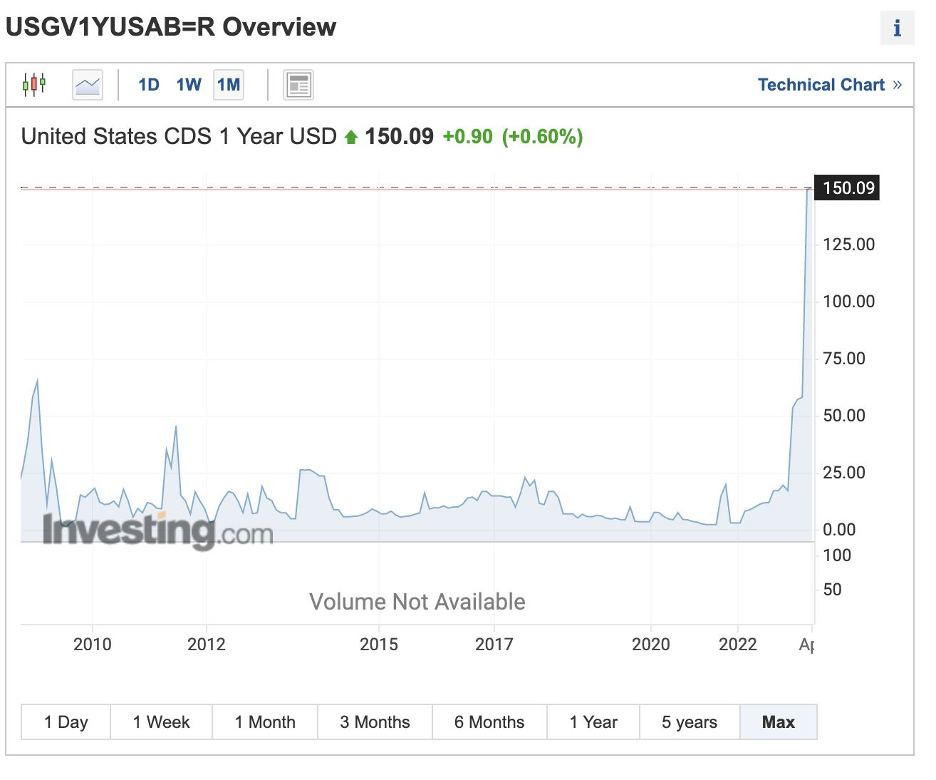
The debt ceiling pertains to the maximum amount of money that the US Treasury is authorized to borrow in order to fulfill the country’s financial commitments. These commitments encompass various obligations like social security and healthcare benefits, tax refunds, military salaries, and interest payments on the national debt. Presently, the limit stands at approximately $31.4 trillion. In January, the United States reached this borrowing limit. If the US lacks sufficient funds to meet all its financial obligations promptly, it would result in a default. A US default would have adverse effects on both its domestic economy and the global economy. Although the likelihood of a long-term default is extremely low, expectations of short-term default can still cause significant harm.
Impact of Default
- Millions of American households will be unable to receive certain federal benefits on time, such as Social Security, Medicare, and Medicaid, as well as federal assistance related to nutrition, veterans, and housing. This directly affects the consumption and expenditure of Americans.
- Default, along with the expectation of default, puts pressure on financial markets and weakens the confidence of consumers, investors, and businesses, leading to reduced spending and hiring, thus impacting the US economy.
- The rating of US Treasury bonds is shattered, and credit rating agencies may downgrade the highest credit rating of the United States. Investors will demand significantly higher interest rates on government bonds to compensate for the additional risk. The borrowing costs for US consumers will rise as rates on mortgages, credit cards, auto loans, and other types of consumer debt are influenced by the trends in the US government bond market. Corporations will also pay higher interest rates on their loans.
- Default would send shockwaves throughout the global financial markets and could potentially lead to a freeze in the global credit market, causing significant turmoil in the financial sector. According to a report by Wells Fargo Economics, during the debt ceiling standoff in 2011, the S&P 500 index fell nearly 17% between July 22nd and August 8th. The US Economic Advisory Committee estimates that if a long-term default occurs, the stock market could plummet by 45% in the third quarter.
Will Default Really Happen?
Due to the volatility in government payments and revenues, it is difficult to determine the exact date of the so-called “X-day” when a US default would occur. Treasury Secretary Yellen estimates that X-day could happen in early June, with the earliest possibility being the first day of June. Congress has the ability to raise or temporarily suspend the debt ceiling during this period to avert a debt ceiling crisis. However, the current impasse raises questions about their ability to act, and we will continue to monitor the debt ceiling issue for its profound implications on the US economy and the cryptocurrency sphere.
Market Analysis: Ethereum Foundation Selling Pressure, Short-Term Top?
On May 6th, the Ethereum Foundation sold 15,000 ETH on Kraken for around $1,988 or $2,000. Unfortunately, some fraudulent information has been circulating, claiming that the Foundation is selling its own tokens, signaling a market top, and suggesting that Ethereum’s price is overinflated. As a result, some individuals have started selling their tokens, causing uncertainty in the market regarding potential withdrawals. This theory lacks support and evidence.
It is worth noting that the Ethereum Foundation has made significant transfers in the past. For instance, they sold 20,000 ETH in November 2021 when the price peaked at around $4,850, followed by an 80% decline. Similarly, they sold 35,053 ETH at a peak of around $3,500 in the local market in May 2021. Some analysts view these patterns as an indication of a potential market top forming around $2,000, which could lead to a price decline in the coming trading days. However, broader data suggests otherwise. For instance, the Ethereum Foundation’s sold 100,000 ETH, its largest sell ever, at the beginning of the 2020 bull-market. Subsequently ETH ran up 10x in the following year. Obviously this time the sell of ETH was the start of a bull-run and not the top.

It is evident that the Ethereum Foundation has indeed made smart sales at certain prices. However, this does not mean that after they sold Ethereum, the price will return to $1,000 or cease to rise. There are many misconceptions about this, and one should not believe such FUD. Looking back at the previous selling points of the Ethereum Foundation, whether at $200 or $600, those prices may never be seen again. Just think about buying Ethereum at $200 three or four years ago, what a profitable investment that would have been, even if it required sacrificing and selling a house. Ethereum has delivered unparalleled returns over the past five years, outperforming other major cryptocurrencies and traditional stocks.
The Ethereum Foundation’s sale of Ether does not imply that Ethereum has reached a long-term top or that the market will enter a bear market or return to a price of $1,000. This is simply a normal selling behavior and a good selling opportunity. It is advisable for everyone to consider selling around $2,000 or $1,900, as we believe Ethereum may weaken in the short term.
Is it worth following the BRC-20 hype?
BRC-20 tokens are experimental tokens on the Bitcoin blockchain that allow users to create NFTs on Bitcoin. They are inspired by Ethereum’s ERC-20 tokens. Due to the surge in users minting BRC-20 tokens, transaction fees on the Bitcoin network skyrocketed last week.

Bitcoin transaction fees have surpassed the peak of the 2021 bull market
Owen Lau, an analyst at Oppenheimer, stated, “There is increasing demand for BRC-20 tokens, including transferring digital collectibles on the Bitcoin network. Bitcoin is gradually supporting a wider range of tokens, such as NFTs. This adoption should be seen as a positive sign, but it appears to have significantly slowed down the network speed.”
From a long-term perspective, we believe that BRC-20 is an effective attempt to develop the Bitcoin network, and we are excited to see more applications and use cases based on the Bitcoin network. If the pace of technological advancements can satisfy expectations, it will be a long-term advantage for Bitcoin. However, in the short term, the congestion and withdrawal difficulties resulting from the sluggish processing speed of the Bitcoin network can exert pressure on the coin’s price and confidence. Furthermore, as BRC-20 shows no signs of significantly improving the TPS of the Bitcoin network, compared to ERC-20 and the significantly more advanced ETH Layer 2 technologies, we see no reason to be more optimistic about the applicability and related applications of the BTC network.
Technical Analysis
BTC
In our previous update, we highlighted the emergence of a classic head and shoulders pattern on the chart and predicted a potential decline below $27,000. The head and shoulders pattern is a well-known technical formation where the target price is determined by measuring the distance from the head to the neckline. The neckline serves as a support level, while the head represents the peak of the pattern. As a result, we anticipated a drop of approximately 10% based on this pattern. Our calculations indicated a target level of approximately $24,000.
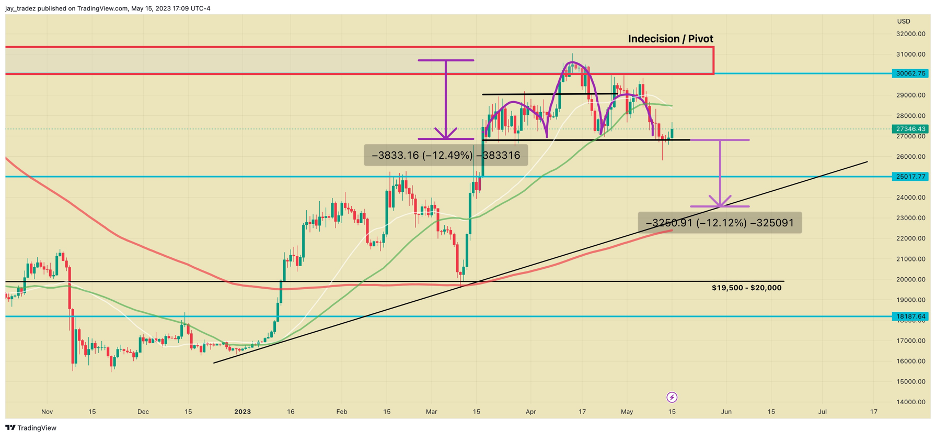
In order to have a higher level of confidence in this analysis, it is important to observe the convergence of multiple indicators supporting this outlook. In this case, the retracement of the trendline suggests a potential target of $24,000, which is the upward trendline starting from the market bottom. Since January, we have witnessed the low point of the Silicon Valley bank crisis and anticipated a rebound to test the $24,000 trendline once again, presenting an ideal buying opportunity. If this scenario unfolds over the next few days, the 200-day moving average is expected to gradually rise within the range of $23,000 to $24,000. Thus, we can establish the price target based on the head and shoulders pattern, the upward trendline, and the support provided by the 200-day moving average.
Additionally, another factor supporting the purchase of Bitcoin in the $24,000 to $25,000 range is the consideration of Bitcoin’s production cost. Taking into account electricity prices and hardware, the estimated production cost of one Bitcoin ranges from approximately $24,000 to $25,000, with a minimum possibility of $21,000 to $22,000. This further strengthens the case for acquiring Bitcoin within the $24,000 to $25,000 range.
While the mentioned target price for making a purchase is indeed favorable, it is crucial to closely monitor the current price action and consider alternative scenarios if the price fails to reach the target level. At present, we are witnessing a strong rebound after breaking below $27,000, which could indicate a false breakdown. The breakout was accompanied by increased selling volume, but a swift rise followed, driven by equally strong buying pressure. This formed a hammer candlestick pattern, typically signaling a potential reversal. If we successfully reclaim the $28,000 level, it would provide stronger evidence of a false breakdown, invalidating the head and shoulders pattern. In such a case, I would seek long entry opportunities.
However, if the price drops below $27,000 again and closes below that level, the range of $23,000 to $24,000 remains a target area for accumulating Bitcoin. It’s worth noting that $25,000 is an area where significant buying interest is concentrated, suggesting a focus on the downside target around $25,000 initially.

To determine whether we have moved out of a bear market and if it is wise to buy during pullbacks or rallies, we can assess the slope of the 200-day moving average. The 200-day moving average smooths out daily fluctuations and represents the overall trend over the past 200 days. If the slope stops declining, it suggests a potential end to the bear market. In the given chart, we can see the price declining over the past year, but it started stabilizing and flattening in January, indicating a transitional phase to a neutral market. The rising slope of the 200-day moving average and the breakout from the trading range between $25,000 and $18,000 indicate a shift towards a potential bull market. However, it’s important to use this assessment method in conjunction with other analysis tools for informed decision-making.

ETH
Taking a closer look at Ethereum, we can observe a similar price pattern to Bitcoin, so please refer to the above analysis for the overall view. However, one aspect that stands out more clearly in Ethereum is its Elliott Wave count. According to Elliott Wave theory, assets tend to move in waves of 5, influenced by crowd psychology, and this pattern has been consistently observed in the past.
At the moment, it appears that Ethereum is in wave 4 of the impulse wave. In this wave count, the target for the wave 4 pullback typically aligns with the top of wave 1, which in this case is expected to be around the range of $1,600 to $1,700. It’s worth noting that in volatile assets like cryptocurrencies, I tend to allow for some flexibility in target levels rather than aiming for an exact price.
Should this scenario unfold as anticipated, I would consider accumulating Ethereum around those price levels or exploring structured products that offer yield while waiting for the price to reach the target.


On-chain Data Analysis
BRC-20 Tokens on Fire, Boosting Mining Revenue
Bitcoin has risen by 70% since the beginning of the year, and recently transaction fees have surged due to the popularity of BRC-20 tokens. With the application of the proof-of-work mechanism, Bitcoin miners are now experiencing their highest revenue since the bear market, earning approximately $40 million per day.

Value Investors Increasing their Bitcoin Holdings
Research from cryptocurrency data website Glassnode reveals that as of May 14th, the number of addresses holding at least 1 BTC has surpassed one million, reaching a new all-time high. Address data trends often correlate with cryptocurrency prices, but recent data indicates that investors are accumulating more Bitcoin despite market downturns, suggesting that Bitcoin is gaining broader recognition and adoption.

Trading Recommendation
Currently, I am planning to buy Bitcoin in the price range of $25,000 to $26,000. As we discussed earlier, the cost of mining one Bitcoin is around $20,000 – $24,000, so the downside is limited, and I don’t expect the price to significantly drop below this level. Additionally, buying at $26,000 and selling at $36,000 would yield a return of nearly 40%. Even if there is an unexpected retracement in price, I believe it is unlikely to go below the 200-day moving average of $22,000 to $23,000. This represents a 13% retracement compared to the potential 40% return, resulting in a favorable risk-to-reward ratio of 3:1. In my opinion, this is a trade well worth considering.
- We recommend a buy parameter at $26,000, with a 2-day BTC bargain, offering a return of 33%. If the Bitcoin price continues to decline, I will buy with a buy parameter of $25,000. The more the price drops, the more Bitcoin I will buy to average down my cost. Overall, I plan to execute this plan in the next five days and reassess my strategy during price fluctuations.

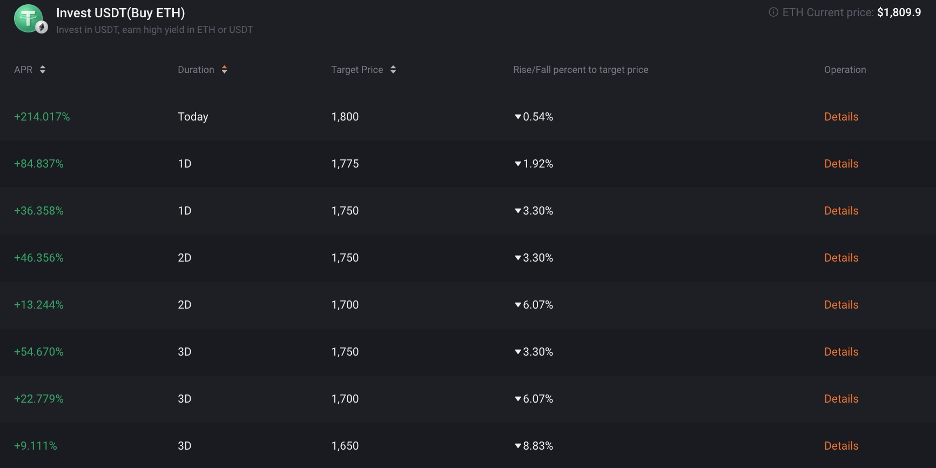
- For ETH, $1,700 is indeed a very good entry point. However, considering the distance from the current price and the slightly lower expected return rate, we recommend using a 10% position to buy with a buy parameter of $1,700. This will be a 3-day ETH bargain, offering a return of 23%. The more the price drops, the more ETH I will buy to lower my cost. We plan to execute this trading plan over the next five business days and reassess our strategy during price fluctuations.