Contents
Abstract
Regardless of the US bond default, it is expected to have a negative impact on the financial market. The cryptocurrency market may not experience a comprehensive bull market even with safe-haven demand. Focus should be placed on BTC’s hedging function.
BTC’s failed attempt to rise to $27,500 has led to a wide-ranging consolidation, with significant buying pressure near $26,000. Consider initiating a buying strategy around $25,000.
ETH has shown stronger momentum compared to BTC, and the buying opportunity around $1,600 is still worth considering.
The BTC seller risk ratio is at historical lows, combined with low volatility retracement, indicating an upcoming major market movement.
- Irrespective of a potential US bond default, it is widely anticipated that the financial market will be adversely affected. The cryptocurrency market, even amidst hedging demand, may have enough gas to be in a bull market. We should focus on Bitcoin’s ability to hedge and weather through political risk.
- Following Bitcoin’s unsuccessful attempt to surpass the $27,500 mark, a period of consolidation followed, with notable buying pressure observed near the $26,000 level. It would be prudent to contemplate initiating a buying strategy at approximately $25,000.
- In comparison to Bitcoin, Ethereum has displayed strength in demand, making it more attractive to buy near $1,600 – $1,700.
- Notably, the BTC seller risk ratio is presently at historical lows, coupled with a retracement in volatility. This confluence suggests an impending significant market movement for Bitcoin.
Macro Analysis
Countdown to US Debt Default
The looming deadline for a US federal government debt default is rapidly approaching. To avoid default, both parties must quickly reach an agreement this week, which can then be submitted to Congress for approval and signed by President Biden. However, the ruling and opposition parties are engaged in a tug-of-war over raising the debt ceiling, causing significant market effects. Fitch Ratings has put the United States’ AAA rating on negative watch due to intensifying political bias hindering debt ceiling resolution. This situation resembles the 2011 US debt crisis, resulting in a downgrade of the US credit rating and a 16% decline in the S&P 500.
Liquidity Crisis and Safe Haven Demand: Potential Consequences
- A debt default would lead to higher credit costs, causing a severe recession in the US economy. This downturn would have a ripple effect on Europe and other regions, destabilizing the global financial system. Furthermore, the loss of confidence in the US dollar could have wide-ranging economic and diplomatic implications. The cryptocurrency market may also be significantly impacted, surpassing the effects on traditional risk markets.
- Even if an agreement is reached, it will take several days for Congress to pass the bill. Moreover, if the US reaches a debt agreement, the Treasury Department will issue short-term government bonds to supplement the balance. However, amidst rising interest rates and tightening balance sheets, this action would reduce market liquidity to meet the demand for additional government bond purchases. Historical data from 2011 suggests a potential decrease of $600 billion in money market liquidity, while European and American markets could experience a liquidity reduction of $1 trillion to $1.7 trillion within six months. The impact on market liquidity is immeasurable.
Capital Group, a renowned fund, expresses concerns about possible significant downgrades to the US credit rating by rating agencies. Such downgrades could lead to increased costs for future US bond issuances, and some investors may no longer view US treasuries as the world’s safest investment. Interestingly, this event could potentially benefit cryptocurrency assets. With the abandonment of US treasuries, gold and bitcoin may regain their appeal as safe haven assets.
Considering the impact on the cryptocurrency community, it is challenging to gauge the full extent of the US debt default event. The convergence of a liquidity crisis (bearish) and safe haven demand (bullish) creates a complex situation. Overall, due to the delayed entry of off-market funds and gradual reduction of on-market funds in the cryptocurrency market, a comprehensive bull market is unlikely, even with the presence of safe haven demand. It is advisable to continue focusing on the safe haven function of Bitcoin (BTC).
Hong Kong Accelerating Crypto Craze
Starting from June 1, 2023, new regulations set by the Securities and Futures Commission (SFC) of Hong Kong will enable retail investors to trade specific cryptocurrencies. However, these cryptocurrencies must meet rigorous criteria in order to qualify for trading eligibility.

To ensure regulatory compliance, cryptocurrency tokens must adhere to strict guidelines set by the Securities and Futures Commission (SFC) in Hong Kong. These guidelines require tokens to have a minimum regulatory compliance period of 12 months, during which the associated projects should be free from any criminal charges. Moreover, these tokens must be listed on at least two major independent investment indices. Failure to meet these criteria will result in disqualification from trading.
Presently, there are ten cryptocurrencies that meet the specified requirements: Bitcoin, Ethereum, Litecoin, Polkadot, Bitcoin Cash, Solana, Cardano, Avalanche, Polygon, and Chainlink. However, stablecoin trading remains excluded due to ongoing uncertainties, as the Hong Kong government currently has no plans to allow it.
This development presents an opportunity for small retail investors in Hong Kong to enter the cryptocurrency market. The shift in the Hong Kong government’s stance toward cryptocurrencies is significant and is expected to have a positive and enduring impact on the overall cryptocurrency market.
Technical Analysis
BTC
There is no uptrend on the monthly chart, with the index facing resistance and undergoing a pullback above $26,000. The weekly trend is downward, leading to a bearish sentiment among most traders. Buying opportunities are seen in the price range between $25,000 and $24,000, and shorting is not considered within this range. A breakthrough above $27,500 would switch the outlook to bullish, potentially pushing the index to $32,000 before entering a consolidation phase. The repeated test and rejections at $27,500 establishes it as an essential level, and a successful retest and breakthrough would signal a shift to a bullish environment.
The market doesn’t have to retest, and some people say they will not buy unless we get a $20,000 retest. However, that is the wrong way to look at it, as the stronger the bull market, the fewer retests we get. However, right now we Bitcoin is just chopping sideways. In this type of market it is best to use a product that is made for the sideways market, such as Bitcoin Flying-Wheel-Bot or the Grid Bot. I do believe we will get a break and bump in volatility so keep my previous advice for next time when the market is stuck within these 5% ranges.

ETH ETH looks stronger than BTC. It should’ve broken down from the false breakout, but it‘s been holding strong under the failed breakout resistance. It constantly reclaims $1,800, which is a level of support. Right now there are also good fundamental support for ETH such as the wait time for staking current around 20 days. Everyone was worried about the Shanghai upgrade and how unstaked ETH would flood in the market. However, now there is actually a wait to stake ETH. ETH looks the strongest out of all 3 coins we have mentioned.

LTC
LTC is looks good as well. It has halving coming up as a fundamental driver and the 200-SMA right below it. The $83.5 – $84 support is a good level as it has been tested multiple times in the past and has confluence with the 200-SMA. At the time of publishing, the price already bounces strongly off the $83.5 level. Beware the 9-EMA is right above at 88.3 will act as resistance. If that level is broken our target is $95.
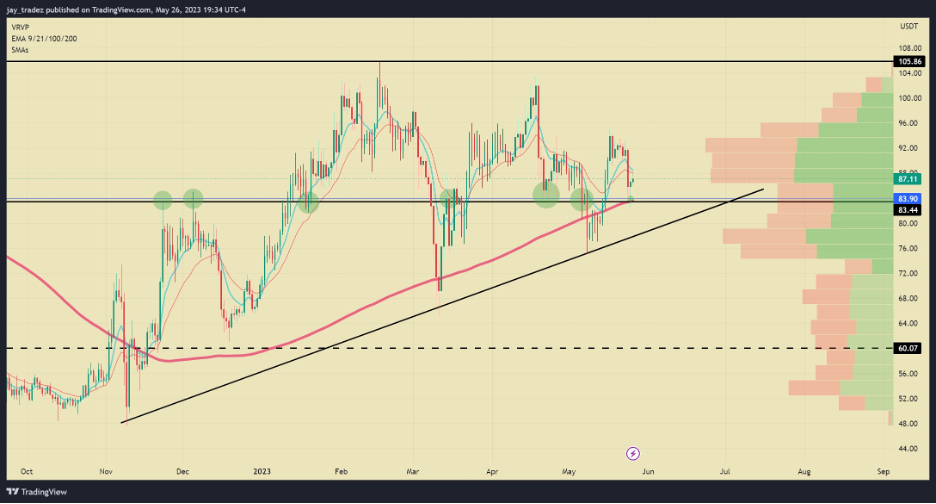
I personally took a trade off that level. If you want to take these type of shorter-term swings be sure to look for entries on the hourly chart. Below you’ll see LTC wick into $83.5 and break under but buyers showed up strongly and pushed prices over gain. A couple of hours later we got a retest and once again buyers stepped up and supported prices. That is when I went long LTC you can see my order below.

Fundamental Analysis
Massive Market Situation is Imminent
According to Checkmatey, a renowned on-chain analyst from glassnode, their research indicates that the BTC seller risk ratio has reached its historical low point. This signifies that investors are currently reluctant to sell their tokens at a profit or loss within the current price range. Such a scenario typically occurs when sellers are exhausted. Seller exhaustion means that, at the current price range, individuals are not making substantial profits or experiencing significant losses. Consequently, this suggests that we require volatility and a new price range to incentivize market movement, indicating an imminent significant market shift.
Similar situations have previously occurred in November 2018, June 2020, and June 2022, all of which witnessed extremely low seller risk ratios followed by notable market volatility. However, it is worth noting that the direction of the market movement was not consistent in these instances: November 2018 saw a market crash, BTC experienced a surge after June 2020, and the market encountered a crash in June of the following year.
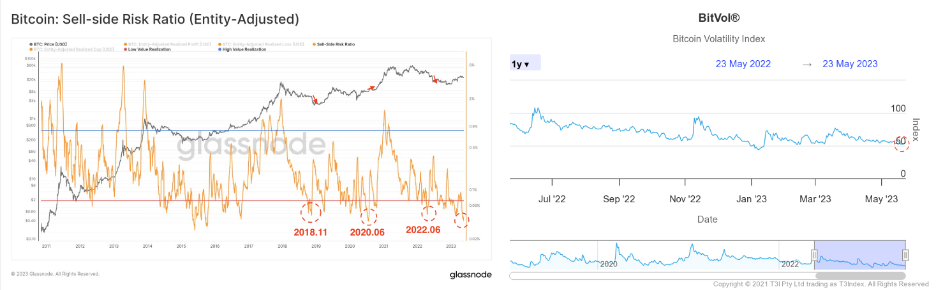
BitVol, a BTC volatility indicator developed by T3 company, has recently reverted to a level that is in close proximity to 50. It is worth noting that in the past year, whenever the volatility reached around the 50 mark, it was consistently succeeded by a notable upswing in volatility. This pattern suggests that a substantial market trend is likely to emerge in the near future.
The growing influence of the crypto options market on the overall direction of the cryptocurrency market can be attributed to market makers hedging their positions. When market makers sell options, they need to hedge their exposure, resulting in passive supply pressure on the price through shorting spot or futures Bitcoin contracts. Conversely, the opposite occurs when prices decline. Without significant fundamental catalysts attracting buyers or sellers, Bitcoin is expected to remain range-bound due to these dynamics in the options market.
Trading Recommendations
Bitcoin typically experiences a 12-month re-accumulation phase after hitting bottom. The expected macro price range is $36,000 to $24,000. Buying Bitcoin within the $24,000 to $25,000 range is advised, considering the cost of mining one Bitcoin and technical analysis indicating a pullback target of around $24,000. The midterm target for Bitcoin remains at $35,000 to $36,000, presenting an 11% retracement and a potential 33% return, with a favorable risk-to-reward ratio of 3:1.
- Due to the low market volatility affecting the product’s returns, we recommend investing in the Buy-the-Dip (BTD) on Bitcoin with price of $25,500 and a 2-day holding period, offering a return rate of 15%. If the Bitcoin price continues to decline, we will use the BTD tool at the target point of $25,000. The more the price drops, the more Bitcoin we will purchase to average down the cost. Overall, the traders at Pionex plan to execute this strategy in the next 7 days and reassess their approach during price fluctuations.

- For ETH, we previously mentioned that the range of $1,600 to $1,700 is a good buying point. However, considering the current price distance and slightly lower expected return, we suggest using a 5% to 10% position to purchase ETH at $1,750 using a 2-day “ETH Buy-The-Dip”, which offers a 15% return. As the price drops further, we will continue to buy more ETH to lower the average cost. We plan to execute this trading plan over the next 7 business days and reevaluate the strategy during price fluctuations.

