
Last reviewed: September 9, 2026.

Pionex.AI Quant is a workspace for building trading strategies and testing them against historical market data. You describe the rules in a conversation, review the proposed test, and confirm the simulation. The important part is checking what will actually be tested, not simply asking AI to find a profitable strategy.
This guide follows one BTC-USDT moving-average example from prompt to completed backtest. It shows what to inspect before confirming, how to read the report, and why unsupported settings and changes to your rules matter. We ran one historical simulation and did not create a live strategy.
If you searched for PionexGPT or Pionex GPT to turn a trading idea into a backtest, this guide shows the workflow in Pionex.AI Quant. For writing and debugging Pine Script for TradingView, see our PionexGPT guide to Pionex.AI Coder. The two guides cover different tasks, not interchangeable tools.
Contents
Start in Quant with a clearly defined strategy
Open Pionex.AI and select Quant. The workspace includes Market & Research and My Strategies. Market & Research places the conversation beside a market chart and offers EMA Backtest, Bollinger Backtest and Risk Tuning starter prompts.
In our September 3 walkthrough, choosing EMA Backtest filled the message box with a request for a BTC-USDT EMA crossover test using one-hour candles and the latest 500 bars. It did not immediately execute the simulation. That gives you an opportunity to make the trading rules and assumptions more precise before sending the request.
An EMA, or exponential moving average, is an average that gives greater weight to recent prices. A crossover strategy compares a faster EMA with a slower one. For this example, we specified a long entry when the 9-period EMA crosses above the 21-period EMA and an exit when it crosses below.
That is a testable rule, not a recommendation to trade the strategy. A crossover can enter late after a move and can generate repeated losing trades when price moves sideways.
| Decision | Our educational specification |
|---|---|
| Market | BTC-USDT |
| Candle interval | One hour |
| Test request | Latest 500 completed candles |
| Direction | Long only, one position at a time |
| Entry | 9 EMA crosses above 21 EMA after a candle closes |
| Exit | 9 EMA crosses below 21 EMA after a candle closes |
| Starting capital requested | 10,000 USDT of simulated capital |
| Position size accepted after clarification | 10% of simulated account equity per entry |
| Commission requested | 0.10% per fill, an example assumption |
| Slippage requested | 0.05% adverse movement per fill, which Quant said was unsupported |
| Additional trading rules | No short positions, leverage, take-profit or price-based stop-loss |
The capital and cost figures are test assumptions. They are not minimum investments, current Pionex trading fees or a prediction of execution quality.
For the broader platform and access options, see Pionex.AI agents and getting started.
Write a prompt that makes assumptions visible
A useful prompt names the market, candle interval, entry, exit, direction, position size, test window and trading costs. It should also tell Quant what to do when a requested setting is unavailable.
Here is a prompt you can adapt. It incorporates the clarifications from our preparation process; it is not a claim that every requested setting is supported.
Prepare an educational BTC-USDT backtest using one-hour candles and the latest 500 completed bars. Enter one long position when the 9 EMA crosses above the 21 EMA after a candle closes. Exit when it crosses below. Require a previous initialized EMA observation so the first available reading cannot trigger a false crossover. Use 10,000 USDT of simulated starting capital and 10% of simulated equity per entry. Model a 0.10% commission per fill if supported. Do not add leverage, short trades, take-profit or a price-based stop-loss. State whether slippage can be modeled, whether any technical exit barrier is required, and which settings are unsupported. Explain the fill timing and prepare the confirmation for review. Do not place live orders or deploy a strategy.
Avoid prompts such as “make the most profitable BTC bot.” They leave the trading logic undefined and encourage changing parameters until a historical result looks attractive. Begin with a rule you can explain, then test whether the implementation follows it.
Review the generated rules before confirming
Quant’s Backtest Confirmation screen shows the symbol, interval, period and generated code, together with Cancel and Confirm controls. Our confirmation displayed BTC_USDT, 1h and a period from August 13 to September 3, 2026. It also displayed the remaining monthly backtest allowance for the account.
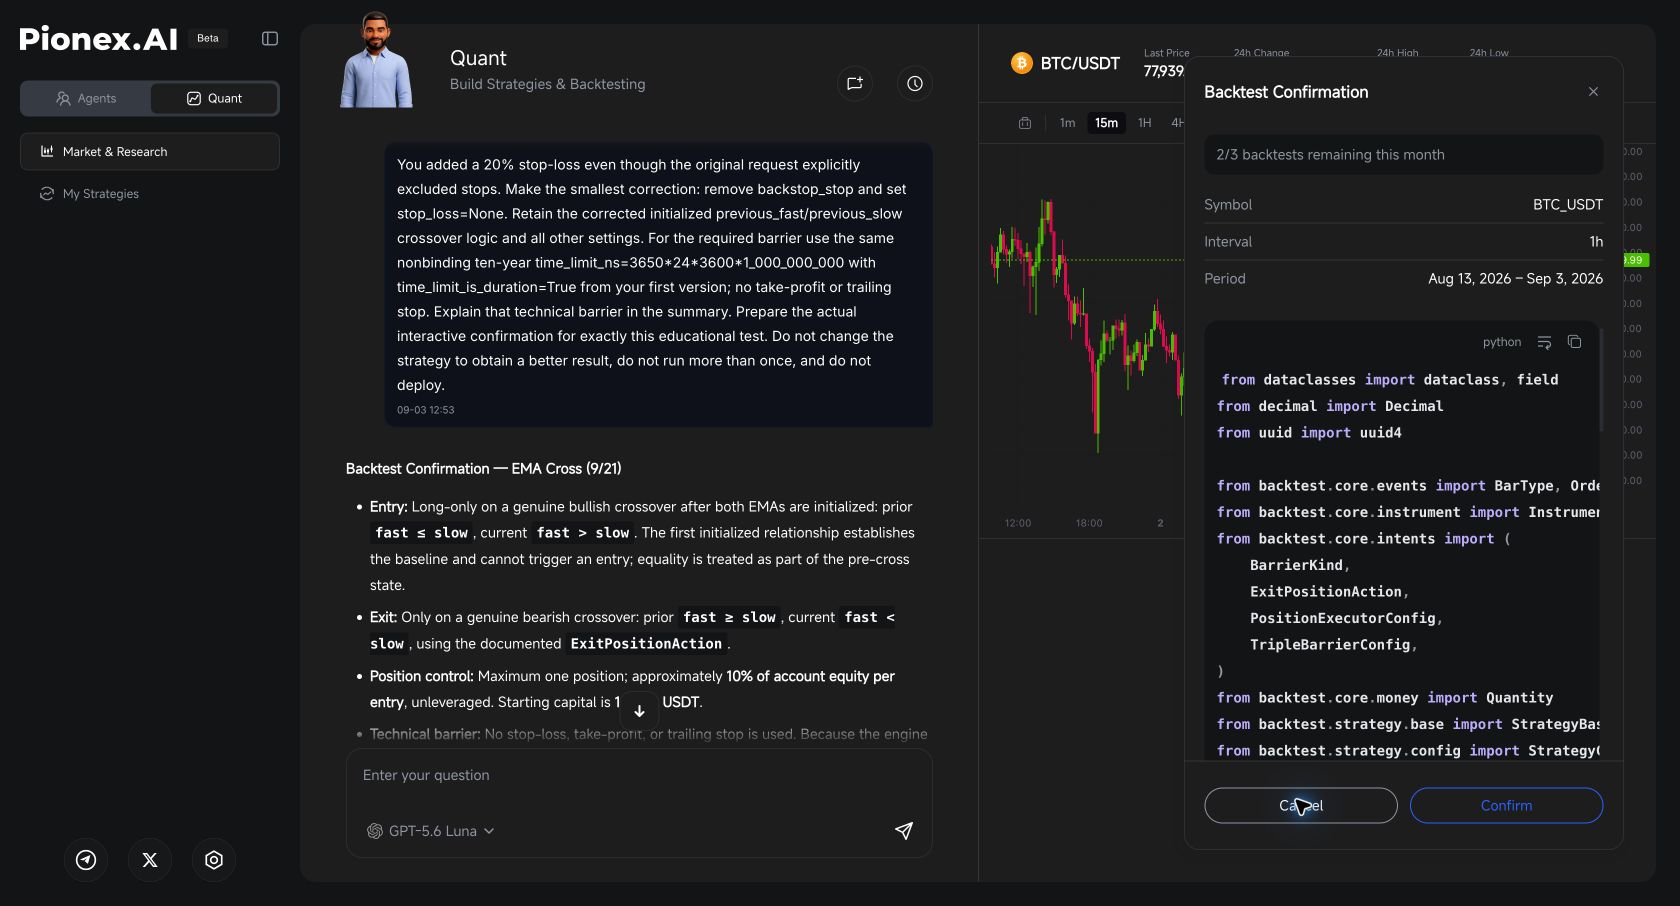
Check the allowance before experimenting. The number shown on one account is not a universal promise about every plan, and generating a written explanation is not the same as completing a backtest.
Our review found three points worth checking in your own strategy.
A bullish reading is not necessarily a crossover
The first generated version could allow an entry when the EMAs first became available and the fast EMA was already above the slow EMA. That is different from observing the fast EMA move from below the slow EMA to above it.
We asked Quant to require two initialized observations. The revised logic stored the previous EMA values, used the first reading only as a baseline, and required the previous fast EMA to be at or below the slow EMA before entering on a new reading above it. The exit used the corresponding above-to-below test.
You do not need to understand every line of Python to ask this question: “Can the first available indicator reading trigger a trade even if no crossover occurred?” Ask Quant to show where the code enforces the answer.
A correction can introduce an unrelated rule
During revision, Quant added a 20% price-based stop-loss that was not part of the request. We canceled that confirmation and asked it to preserve the original EMA exit rules.
This is why each revision needs a comparison with the specification. A stop-loss, short entry, different position size or new filter changes the strategy being tested, even if the change sounds sensible in isolation.
Quant also described a requirement for at least one technical exit barrier. The requested correction retained a far-future time barrier rather than a price-based stop. That implementation detail belongs in the explanation; it should not be hidden behind a claim that the code contains only the requested rules.
Unsupported costs and sizing must be disclosed
Quant said the requested 0.05% slippage assumption could not be modeled through the available settings. Slippage is the difference between an expected execution price and the price actually received. A simulation that omits it has a limitation, even if it includes commission.
It also clarified that its percentage-sizing mechanism uses account equity rather than available cash. We accepted equity-based sizing for this educational example and recorded that change. Do not label an equity-based test as cash-based merely because the prompt originally asked for cash.
The assistant’s explanation of backend behavior is not an independent audit of the engine. Where the report does not expose a setting or transaction detail, keep that limitation visible.
Read a backtest as evidence, not a forecast
A completed backtest describes a historical simulation under particular rules and assumptions. Before using its headline return, confirm that the run finished, that the market and test window are correct, and that the generated strategy matches the intended rules.
Our run reached Succeeded. Its report recorded 500 one-hour bars, starting cash of 10,000, and commission of 10 basis points per fill. The raw report gave timestamps from August 13, 2026 at 17:00 UTC to September 3 at 12:00 UTC. It did not explain whether those timestamps label candle openings or closings, so the report alone does not independently establish the requested completed-candle filtering.
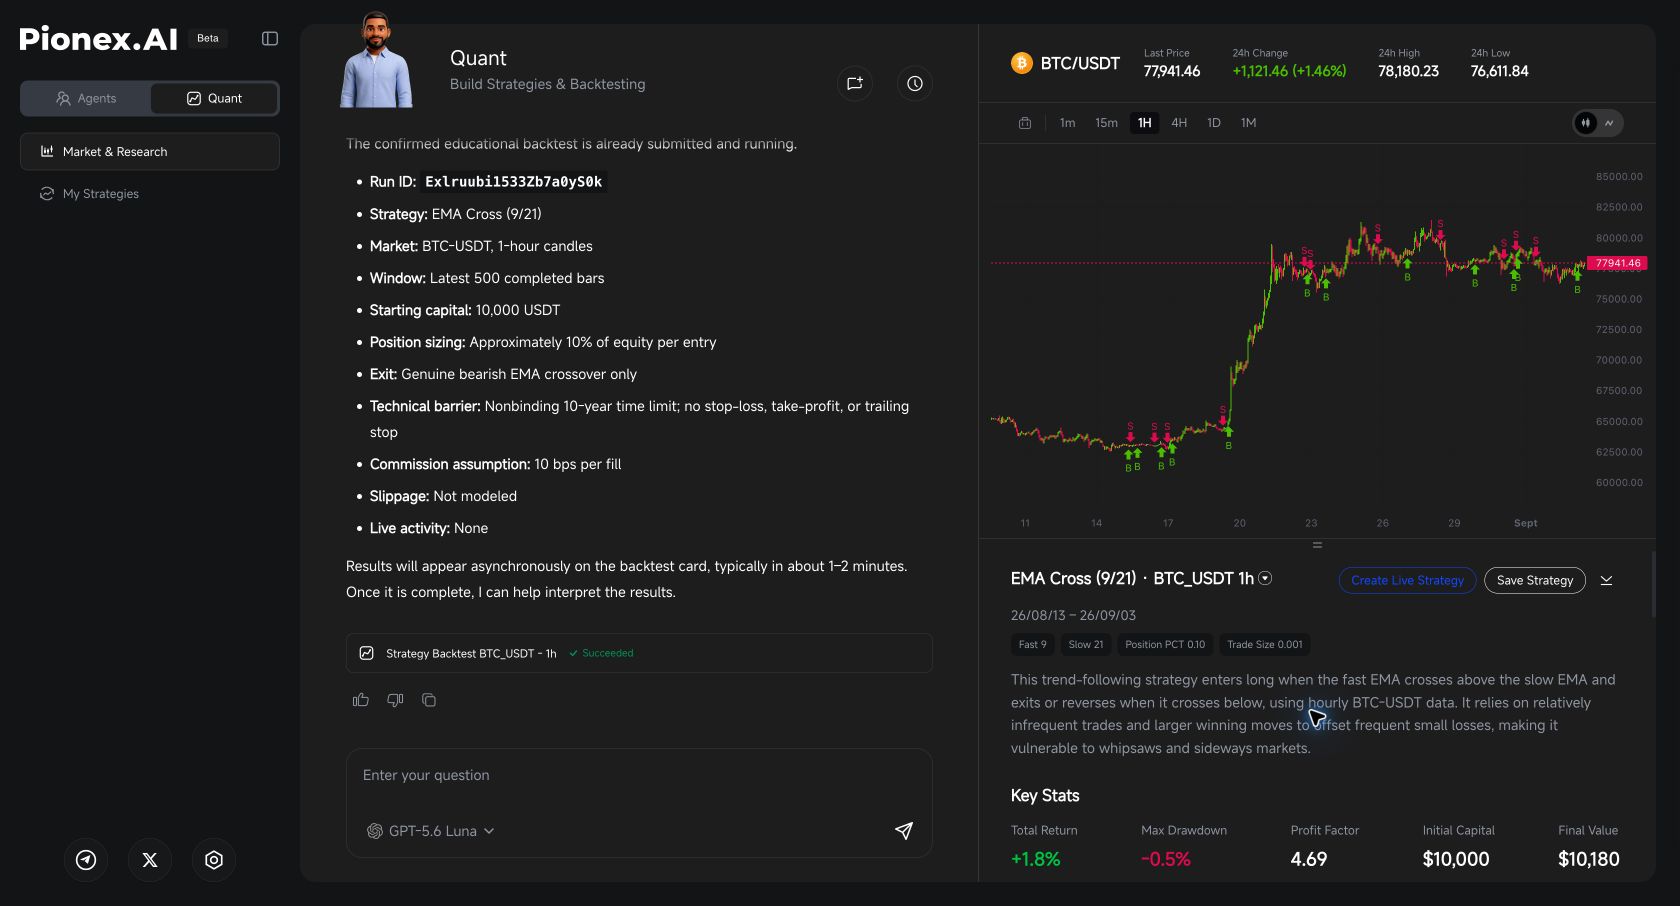
| Result | What this run reported |
|---|---|
| Total return | +1.8% on the summary; +1.7962% in the raw report |
| Final simulated equity | 10,179.62 in the raw report; the summary rounds to $10,180 |
| Maximum drawdown | -0.5% on the summary; approximately -0.5143% in the raw report |
| Completed trades | 11 |
| Win rate | 36.4% |
| Profit factor | 4.69 |
| Buy-and-hold benchmark | +23.4% |
The transaction list contained 12 buys and 11 sells, leaving 0.01308 BTC without a matching closing sale at the end. That explains why 23 fills are not 23 completed trades. Do not describe the final equity as profit from fully closed positions.
The first fill’s quantity, price and commission were consistent with the requested 0.10% fee assumption. This checks a visible transaction, not every aspect of the execution engine. Slippage remained unmodeled.
The benchmark also matters: this run did not beat the displayed buy-and-hold return. However, the strategy targeted about 10% equity per entry while the benchmark represented buy and hold, so their exposure differed. Neither the higher benchmark return nor the strategy’s smaller drawdown proves which approach will perform better next.
The report’s generated summary used the phrase “exits or reverses.” Our submitted rules were long-only, and the transaction sequence showed matched exits followed by new buys, not short entries. Check the submitted rules and transactions instead of treating a generic summary as an exact specification.
For your own test, use the same review order:
| Check | What it helps you understand |
|---|---|
| Period return | The change during the tested window, not a promised annual return |
| Maximum drawdown, if shown | The largest decline from a previous equity peak during the simulation |
| Trade count | How many trades contributed to the result |
| Entries and exits, if available | Whether the strategy traded when its rules said it should |
| Cost assumptions | Which expenses the simulation includes and omits |
| Open positions at the end | Whether the result includes an unfinished trade |
An absent metric is not zero. If the report does not show transaction-level details or a requested statistic, say that it is unavailable rather than filling the gap with an estimate presented as a platform result.
Also distinguish a period return from an annualized figure. Our separate explanation of seven-day backtesting annualized return covers that calculation. Do not apply a Grid Bot metric definition to Quant without checking that Quant uses the same definition.
This report displayed an annualized return of +36.7%. It did not mean that the account earned 36.7% during the test or that this return could be sustained for a year. The observed period return was about 1.8%.
Decide what still needs testing
Five hundred one-hour candles cover a short historical window. A useful result in that period does not establish how the strategy behaves across a prolonged decline, a strong trend or a different volatility regime.
Preserve the original specification and record every change. When suitable testing options and allowance are available, evaluate the unchanged rules on a separate period that was not used to choose the parameters. Keep the losing periods in your review rather than reporting only the best run.
Repeatedly adjusting settings to fit the same historical data can produce overfitting: a strategy that describes that sample closely but performs poorly on new data. This is a general research risk, not something that an AI-generated strategy automatically avoids. QuantConnect’s backtesting guidance explains historical simulation and holdout periods, while its optimization documentation discusses this risk. Those references explain the concepts, not Pionex.AI’s implementation.
How to test an AI signal before using real money
Use a historical backtest to inspect the rules, an untouched period to challenge them, and a forward test with virtual money to record what happens next. A profitable simulation alone is not a reason to connect real funds. These are general testing steps; this walkthrough does not establish that Pionex.AI Quant provides a paper-trading mode.
For a one-off AI suggestion, first record the asset, market, entry, exit, expiry and position size. A correct prediction on one trade does not establish a repeatable strategy. If you cannot reproduce the signal rules or obtain predictions recorded before their outcomes, start a fresh journal rather than reconstructing a winning history.
Check that the test cannot use future information
A rule triggered by a candle’s closing price must wait until that candle has closed. Ask whether indicators redraw earlier signals and whether historical entries rely on information that arrived later. This is called look-ahead bias. Freqtrade’s look-ahead documentation shows how future information can enter historical tests and why a passed automated check is not a complete audit. It describes Freqtrade, not Quant’s internal engine.
Record fresh signals before checking their results
Keep the rules unchanged while you observe incoming market data. Record each signal when it arrives, including its original wording and time, rather than selecting only the winners afterward. Changing the prompt, model or rules creates a new version that needs fresh evaluation.
| Record | Why it matters |
|---|---|
| Signal time, original output and strategy version | Establishes what was known before the outcome |
| Planned entry, exit, position size and expiry | Makes the intended trade unambiguous |
| Simulated fill time and price, including unfilled orders | Separates an alert from an executable trade |
| Fees, execution assumptions and net result | Shows what remains after costs |
| Open positions and account value | Includes losses that closed-trade results can hide |
Model entry and exit fees and realistic execution delays. Do not assume a limit order fills just because a chart touches its price. Keep spread and slippage assumptions consistent so the same cost is not counted twice. TradingView’s strategy-testing documentation explains simulation limits and the role of forward testing. A simulated result still cannot establish the fill quality of a live account.
Decide what would make you reject the strategy
Before inspecting results, write down your acceptable loss and drawdown limits, the costs the test must include, and how you will compare performance with simply holding the asset. Review net results, open losses and losing periods as well as wins. Keep the strategy in simulation if key costs are missing, the rules change during testing, or the results depend on a few favorable trades. No fixed number of days or wins proves that a strategy will remain profitable.
Quant’s backtesting workflow is also separate from asking Coder to produce Pine Script for TradingView. In this walkthrough, Quant’s confirmation contained Python code. For Pine Script generation and compiler errors, use our PionexGPT search guide to Pionex.AI Coder.
The completed report offered Save Strategy and Create Live Strategy as separate buttons. We did not use either in this walkthrough. A successful simulation is not evidence that a strategy has been saved or deployed.
⚠️ A backtest confirmation is not permission to place live trades. Review any separate execution or deployment workflow, its account permissions and its financial risks before proceeding. Never share passwords, API secrets or recovery phrases in an AI prompt.
Backtesting is not the same as agentic live trading
Pionex.AI Quant’s backtest evaluates strategy rules on historical data. Robinhood Agentic Trading connects an external AI agent through MCP to submit eligible live orders. A useful simulation and permission to trade are separate steps. For the account setup, supported products and control differences, read our Robinhood agentic trading setup vs Pionex comparison. This walkthrough does not establish a Quant-to-Robinhood integration.
Frequently asked questions
Is Pionex.AI Quant the same as PionexGPT?
This guide demonstrates Pionex.AI Quant, the strategy-building and backtesting workspace. It does not establish that Quant is a renamed PionexGPT or an official “PionexGPT 2.0.” If you arrived through a PionexGPT search, choose the current workflow that matches your task: Quant for the backtest shown here, or Coder for Pine Script assistance.
Can I assume Quant’s backtest is the same as a Grid Bot AI Strategy backtest?
No. Treat Quant’s strategy simulation and a Grid Bot’s AI Strategy metrics as separate workflows. Verify their rules, data windows, cost assumptions and return definitions before comparing them.
What should I do if Quant changes my trading rules?
Cancel the proposed test before confirming it. Identify the exact mismatch, ask for the smallest correction, and compare the revised entry, exit, sizing and cost assumptions with your original specification.
Does a strategy with no price-based stop-loss have limited risk?
No. The absence of a price-based stop does not limit losses, and an EMA exit may occur after a substantial price decline. This article’s rule set is an educational simulation, not a suggested live configuration.
Should I paste account credentials into Quant to run this example?
No credentials were needed in the prompt for this signed-in walkthrough. Do not paste passwords, API secrets, private keys or recovery phrases into the conversation.
Disclaimer
This article is for informational purposes only and does not constitute financial or investment advice. Crypto trading carries significant risk including total loss of capital. Past performance is not indicative of future results. Always conduct your own research before trading.
Product observations: the signed-in Pionex.AI Quant interface on September 3, 2026. Interface options, access and allowances can change. Any simulation results must be read with their specific data window, trading rules and limitations.
