Contents
Abstract
- Coinbase got approved by National Futures Association (NFA) to start buying and selling futures contracts. The first crypto exchange to be allowed to offer leveraged crypto futures in the US.
- China Evergrande filed for bankruptcy in the U.S. markets afraid of slowdown in China and spillover effect into the global economy.
- $1 Billion liquidated in BTC and ETH as prices declined over 10% in hours.
- Technical levels coming up for BTC $23,000 and $20,000. Despite multiple positive factors since June, the cryptocurrency market hasn’t seen improved liquidity, resulting in a restructuring of key participants.
- The 10-year US Treasury yield has surged to its highest level since 2008, triggering a sell-off in major asset classes in recent times.
- Elon Musk’s SpaceX did not sell Bitcoin on the day of its decline; however, it primarily influenced market sentiment.
- Europe approves first Bitcoin ETF. Link
Fundamental Analysis
Traceable Sell-off
Thursday evening bore witness to a significant decline in the cryptocurrency market, with Bitcoin briefly plummeting to $25,000. The global financial markets were gripped by tension arising from currency instability, concerns surrounding China’s economy, and historically high bond yields. Leading cryptocurrencies such as BTC and ETH suffered substantial losses, reaching their lowest points since the early summer.
The recent market downturn is believed to have originated in the U.S. Treasury market, where the 10-year Treasury yield surged to 4.25% – its highest level since October of the previous year as well as 2008. This spike in yields triggered noteworthy declines in major assets, including U.S. stocks, gold, crude oil, and Bitcoin, setting off a chain reaction of sell-offs. Adding to this downward spiral was Elon Musk’s SpaceX, which divested its entire Bitcoin holdings. This move, coupled with a prevailing sense of panic, further contributed to the market’s sustained decline.

Bitcoin’s decline has extended over six consecutive days, resulting in an overall drop of 12%. This swift descent caused Bitcoin’s value to briefly plummet from nearly $29,000 to $25,000 within a mere 24-hour period. Subsequently, it has managed to regain some ground, stabilizing around $26,000. However, if the global landscape continues to witness a downfall in risk assets, the cryptocurrency market will likely not remain unaffected.
We think an infusion of incremental funds is deemed necessary to inaugurate a new bullish phase in the cryptocurrency market. Yet, in the broader context where both the U.S. Federal Reserve and global currencies are adopting stricter measures, and there exists a deficiency in incremental money supply, the notion of ETFs has emerged as a key source of liquidity and market sentiment. Despite the numerous favorable factors that emerged since June, which were anticipated to enhance liquidity within the crypto sphere, the recent downturn is not entirely unexpected. It has retraced to the low point of $25,000, just before the optimistic ETF developments in June. This recent and sharp decline seems to be a strategic restructuring move by major market participants, involving the eradication of long positions while awaiting a redistribution of assets.
Unexpected Liquidation
The sell-off appears to have been triggered by significant spot selling on Binance, as evidenced by the Volume Delta analysis. Notably, there was a sharp surge in the Volume Delta metric on Binance, occurring ahead of relatively calmer selling pressures observed on Coinbase and OKX.

According to data from Coinsoto, this sell-off resulted in the liquidation of positions exceeding $1 billion. Interestingly, even the FTX incident failed to induce widespread liquidations similar to the prior week, catching the market by surprise.

Blofin suggests that market makers have accumulated a substantial positive Delta exposure on the CME exchange. To offset this exposure during settlement, they may need to tap into liquidity from non-CME exchanges. This scenario could potentially lead to a liquidity crisis, triggering a market-wide panic and causing a rapid flash crash.

In the realm of Ethereum, some of the most notable liquidations occurred on Binance, particularly concerning the ETH/BUSD trading pair. A single trader or entity experienced the liquidation of 55.92 million ETH at a price of $1,434, significantly below the prevailing market price. This divergence can be attributed to the comparatively lower liquidity of BUSD pairs, allowing for deviations of 5-10% during periods of heightened volatility.

Technical Analysis
BTC
For those who are still holding onto the short-trade initiated from $30,000, congratulations are in order. If you managed to cover at $29,000, then there’s no harm done. However, if you are still holding the position, we strongly recommend considering covering it at current prices, given the critical significance of the $25,000 level.
Now, let’s delve a bit deeper into the substantial sell-off.
Key News Factors:
- FUD surrounding SpaceX selling Bitcoins.
- China’s Real Estate Market: Economic deterioration in China’s real estate sector.
- Dollar and Treasuries Movement: Continued upward momentum of the dollar and long-term treasuries.
- Stock Pullback: Pullback observed in SPY and QQQ.
In the preceding month, we discussed why BTC appeared bearish, particularly as it failed to rally even after positive news about BlackRock’s ETF involvement. We highlighted the concept that if BTC cannot maintain or rally on favorable news, such as institutional players entering the ETF market, it would struggle even more when confronted with negative news. The logical outcome being a swift downward movement on negative news, given its lack of resilience in the face of extremely positive developments. Last week, we witnessed the manifestation of this scenario, as unsupported FUD about SpaceX’s Bitcoin holdings, combined with overleveraging in the futures market and limited liquidity, triggered the sell-off.

Taking a different perspective, let’s consider the open interest (OI) of futures contracts, representing the aggregate positions taken by traders. A positive OI value indicates the creation of new long positions, counteracted by newly opened short positions. In the past week, the OI on futures approached previous highs, reaching approximately $12 billion. This level of OI was last observed near before the Luna collapse. Typically, futures contracts involve some degree of leverage, implying that with such significant OI, there’s likely a considerable amount of leverage in the system. This is evident from the substantial capital lost due to liquidations. In a scenario where high leverage and limited liquidity coincide, a cascading liquidation crisis can be easily triggered by a small percentage drop in price. Precisely this chain of events unfolded, resulting in over $1 billion in liquidations and wiping out around $3 billion in OI.
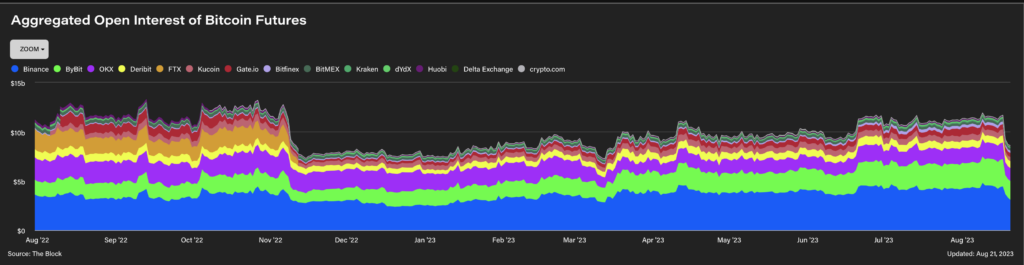
This sell-off also marked one of the most significant declines in OI since the beginning of the bear market, surpassing the decrease in OI during Luna, 3AC, and FTX collapses. Such occurrences are rare in the current market landscape.

Taking a deeper look into the technical aspects, it’s evident that we’ve diverged significantly from the uptrend that had persisted since the outset of 2023. We’ve broken below the trendline that interconnected each higher low and the 200-day Moving Average (MA). Even though $25,000 has proven to be a robust level, historically tested multiple times as both support and resistance, it’s important not to disregard the fact that we’ve breached the 2023 uptrend for the first time. Presently, with the Open Interest (OI) standing around $8.5 billion, as per data from TheBlock, retracing back to the lower levels of 2023, we’ve effectively flushed out some of the leveraged long positions. This affords us a more stable foundation for a potential upward movement when positive news about Bitcoin eventually emerges.
Should we break below the $25,000 mark, the downside risk is large, but this might manifest as a gradual consolidation decline. With the decreased OI, the likelihood of another cascading liquidation event diminishes. Turning our attention to the Volume Profile (VRVP) chart, we can identify significant clusters of trades in the $19,000 – $20,000 range. Should the price reach this zone, it would be considered a high-value area, prompting us to recommend building a position. The subsequent smaller support demand zone lies around $23,000, where we would be inclined to buy if there is tangible evidence of demand from buyers.

ETH
Ethereum appears weaker compared to Bitcoin, particularly due to its breach below the previous higher low of $1,600. Unlike Bitcoin, Ethereum failed to establish a new high during the recent rally. Analyzing the weekly chart, it’s evident that Ethereum encountered resistance at the $1,900 level, failing to surpass it. This struggle ultimately resulted in a substantial capitulation candle that breached critical support levels.
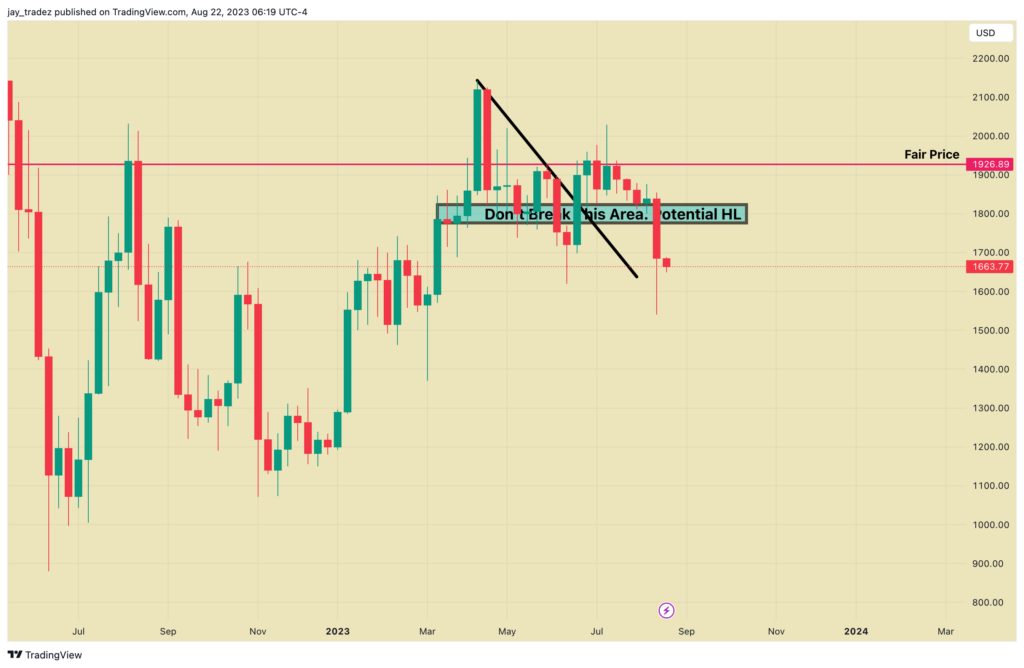
Shifting our focus to the daily chart, a significant zone of demand becomes apparent around the $1,500 level, precisely where the bounce occurred. In the event of further downward continuation, we would not recommend considering purchases until the price approaches the $1,200 – $1,300 demand zone, as indicated in the chart below.

In a broader perspective, the $1,600 level serves as a substantial support that has undergone numerous tests. However, the frequency of these retests gives us pause when it comes to suggesting buying at this level. This hesitation is further accentuated by the breaking of the 2023 uptrend.
Trading Recommendation
BTC
We suggest considering a Buy-the-Dip for BTC at $25,000 with a duration of 1-2 days, aiming for an annualized return of 23% – 43%.

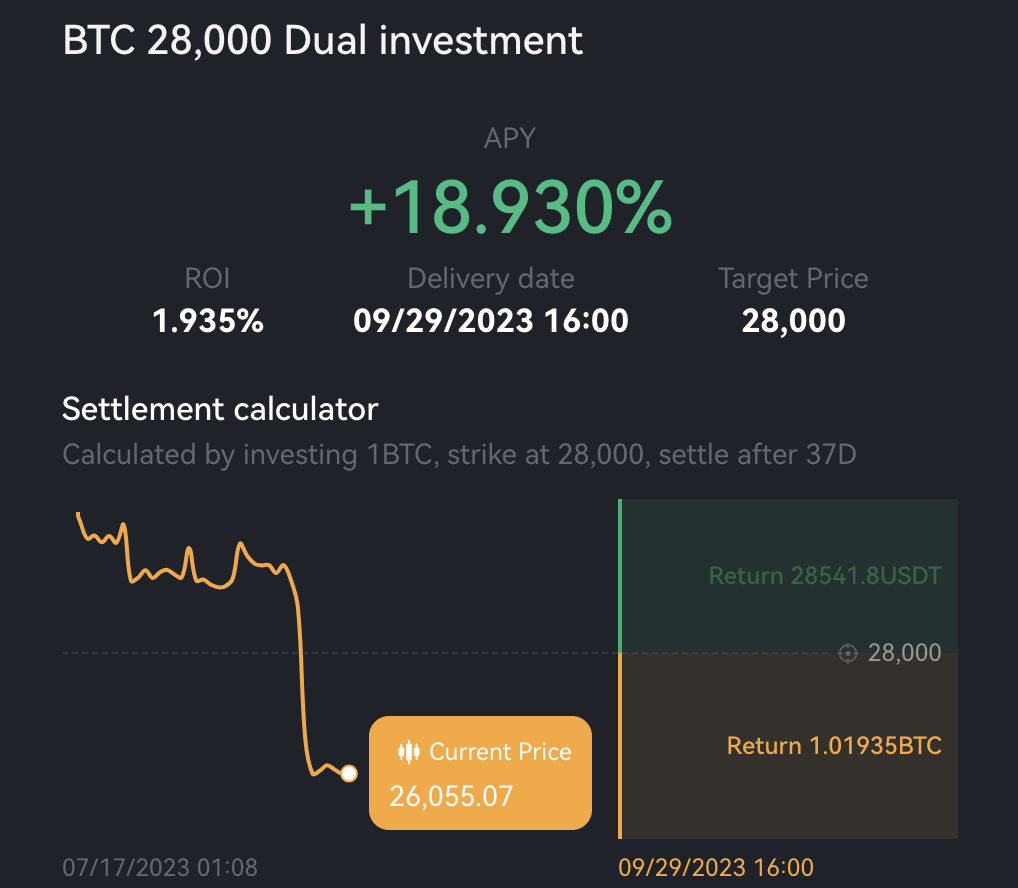
Last week our orders of Buy-The-Dip were executed at $28,000 due to the rapid decline. For those that followed our recommendation we would now recommend using longer-termed covered-gain to lock in yields while volatility is high. We recommend 16D or 36D, $28,000 strike covered-gain with 16-18% APY. We expect volatility to decrease once again as that has been the trend for the crypto market overall, sudden spike in vol and gradual fade. So locking in a good yield right now seems like the best path of action.

ETH
We recommend considering a Buy-the-Dip for ETH at $1600 with a duration of 2 days, targeting an annualized return of 23.5%.

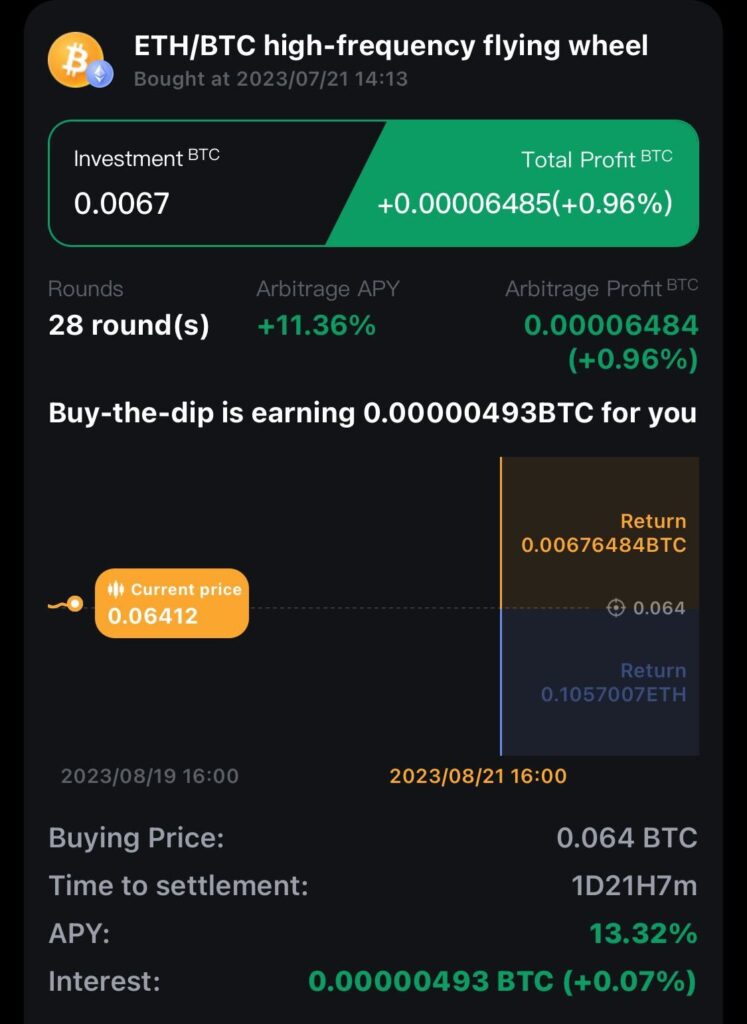
ETH/BTC
In the midst of the ongoing market downturn, the ETH/BTC exchange rate has managed to rebound from its lowest point, displaying relatively consistent performance. Our suggestion is for users to consider a strategy of gradually accumulating coins in preparation for an impending major bull market. On the app’s main page, you can find the option labeled “ETH/BTC high-frequency flying wheel.” As of now, this strategy can yield an approximate annualized interest of 13%, achieved through daily compounding. This approach allows you to generate earnings without the need to concern yourself with selling your coins for immediate profit. It serves as a robust and reliable financial strategy, especially when considering the potential for a significant bull market in the future.