Major event warning
12-1 Thursday
- ISM manufacturing PMI 49 vs 49.8 expected. This is a leading indicator of manufacturing payrolls by 7 months. This aligns with our view of recession and increased job losses into mid-year 2023.
12-5 Monday
- ISM Non-Manufacturing PMI 56.3 vs 53.3 expected. Given the above 50 reading, it is still growing, which contradicts the manufacturing PMI. However, new orders are slowing MoM, which is not a good sign for future growth. This also stoked fear that the Fed will continue its tight policy despite fears of recession.
- Australia Interest Rate Decision 25 bp expected.
12-6 Tuesday
- PCE inflation data.
12-7 Wednesday
- BoC Interest Rate Decision 50 bp expected.
- Japan GDP QoQ Q3 -0.3% expected.
12-8 Thursday
- Initial Jobless Claims we don’t expect this to cause too much change in the market.
12-9 Friday
- Producer Price Index is a leading indicator of consumer inflation expected at 0.2% MoM. We are in a downtrend, so if we see a big increase in the MoM number, expect a dip in the market.
12-14 Wednesday
- FOMC meeting – Major possible pivot point.
Summary
- Powell’s talk led to the biggest 1-day gain in Bitcoin since 11/10/22.
- Whales with > 1000 BTC accumulated Bitcoin heavily after the FTX bankruptcy.
- Financial Times reported Genesis owes customers of Gemini $900 million from the earn program.
- Oil prices are up due to China’s reopening and relaxing of the zero-covid policy.
- SBF claim’s he had very little knowledge of Alameda operations despite owning 90% of it.
Bad News
Starting with some bad news. This week it was reported by Financial Times Genesis owes $800 million to customers of Gemini, and they halted withdraws due to insufficient liquidity concerns. However, this does not mean they are insolvent. As a lending firm, they could’ve lent out their capital in longer-term loans that cannot be called back. After suffering a 200 million dollar loss from funds on FTX, they have a liquidity crunch.
However, saying all of this, we are not sure why they would hire a restructuring firm to “explore all options”. A firm with illiquid assets could wait until those loans are returned or called back to boost liquidity. So given that contradictory information, we believe it is best to prepare for the worst. In this case, the bankruptcy of Genesis. With the collapse of FTX, we saw Bitcoin and Ethereum fall by 25% and 30% respectively. That was off an approximate $14 Billion loss in investor capital. This time according to Bloomberg, Genesis has around $2.3 Billion in outstanding loans. So even if they were to go bankrupt, this would have around ½ of the effect as the bankruptcy of FTX. We added in more weight because Genesis Trading is a counterparty to many institutions and one of the oldest operations in the crypto space. Genesis’s bankruptcy would definitely cause a decrease in confidence in the space, plus doubts about Digital Currency Group’s effectiveness and reliability.
Given this scenario to happen, we expect another 12% decline in BTC and a 15% decline in Ethereum. This would represent $13,000 and $900 respectively.
Good News
Now, moving on to some good news. According to on-chain data analytics, whales with >10k BTC have been accumulating more than the past 3 months. The bigger the blue circle represents, the higher the amount of BTC bought by a whale wallet. As seen in the graph below, there has been high frequency and increased size of accumulation, signifying “smart-money” believes these are near-bottom prices for BTC.

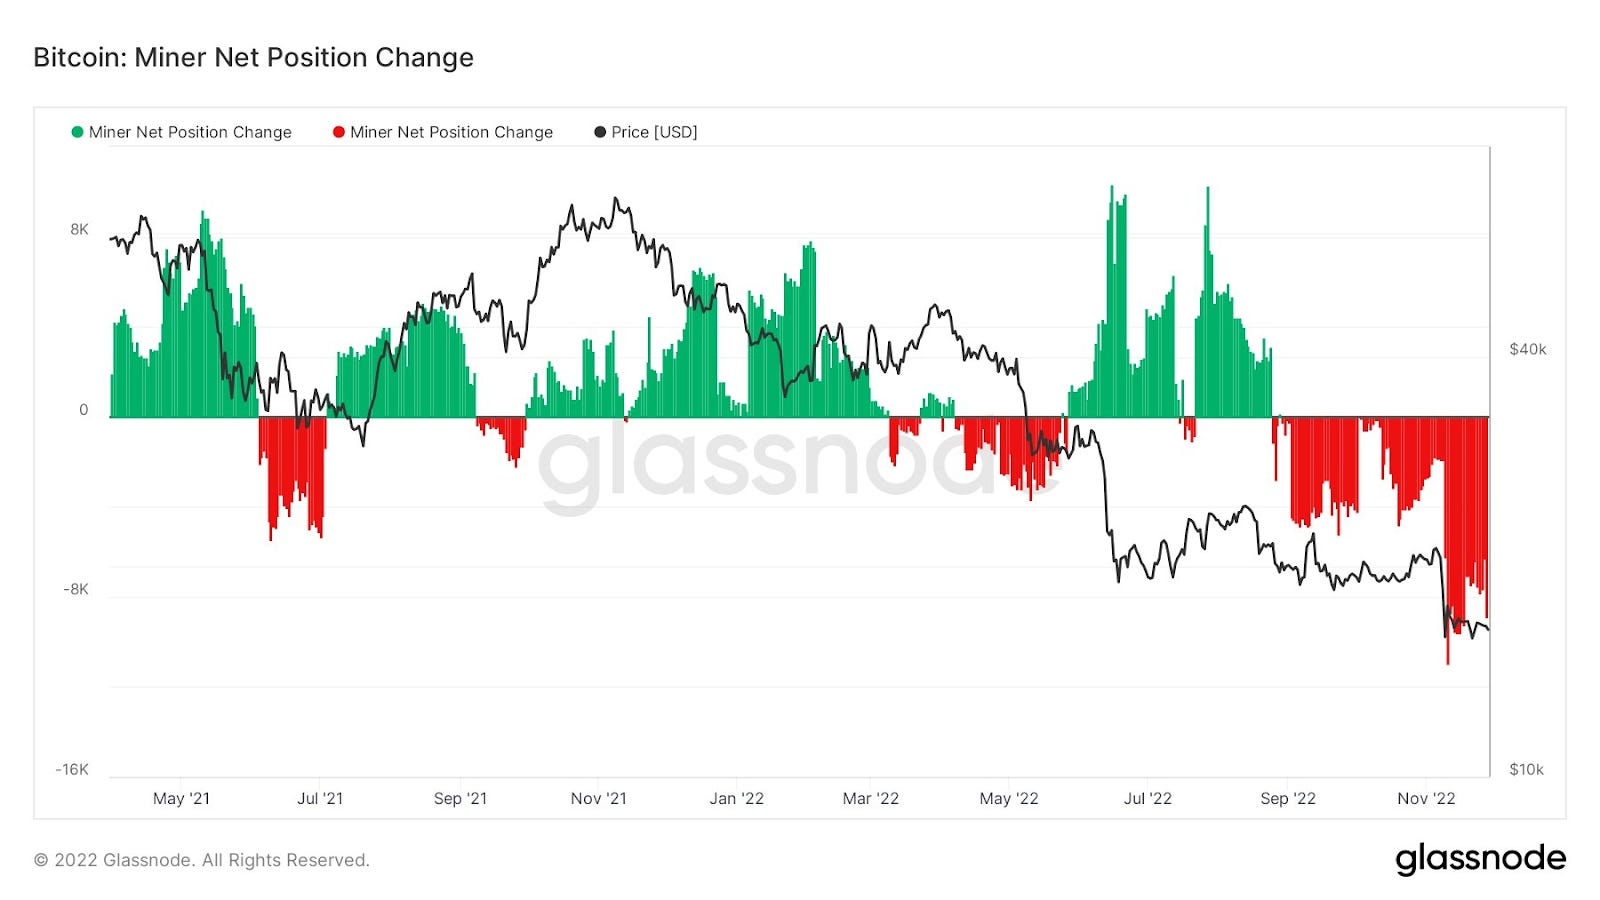
In the past month, ever since the FTX collapse, miners’ net positions have decreased significantly. In September, the transfer volume doubled as miners moved BTC out of their wallets. This does not necessarily mean that miners are selling, but in talking with some miner partners, everyone is feeling the heat. Miners capitulating is another indicator that we are getting close to a bottom, as miners are usually the last group of BTC holders to sell. This is generally caused by extreme compression of profit margins from huge price decreases. Ironically when this cohort of holders sells, it is usually within 10-20% of the bottom as they are the most stubborn holder. When we zoom out into a longer timeframe, we can see that 2018 had multiple large outflows from miners at the bottom. The first large outflow was only associated with a local bottom, while the subsequent outflows and steady low BTC net balance showed a real bottom followed by a recovery. We believe this can be attributed to miners “learning their lesson” and not holding on to BTC but selling them for profit as they are mined due to the compressed margins experienced a few months prior.

Technicals
BTC
Bias: Long-term Bearish, Medium-term Neutral

After Powell’s talk of a pivot pumped the markets last week, we have been trading in an extremely tight range. We are hovering over $16,800, the midlevel of the engulfing candle created on Wednesday. We have tested that level multiple times, so it appears to me that it is relatively strong support and could be bought if you are bullish into December. I don’t see any clear signals for trading in either direction and would rather wait when prices are stuck in the middle of a range.
3 scenarios BTC
- Break under $16,800, and we will likely test the range low of $15,800 – $16,000
- Hold $16,800 – $17,000 with strong liquidity to absorb the current supply, and we will likely test the range high of $18,300, with a chance to overshoot and re-test $18,500.
- We consolidated between $16,500 – $17,500, showing no real direction and wasting everyone’s time.
I recommend waiting until BTC shows invalidation of the bear or bull move before considering a trade. Over $18,300, we would have a clear invalidation of the bear move and will be looking to get long. Under $16,000, we have an invalidation of the bull move. When prices are in the middle of a range and the direction is unclear, I use structured products to generate yield as they are less directional than long/short trading. Read below for our recommended trade with structured products.

For long-term traders, let’s take a look at the monthly chart of BTC. We just got a candle close for November, and it closed as a bearish engulfing candle. An engulfing candle represents a candle stick that’s high and low and both higher/lower than the previous candles. Going from only this technical perspective, we will likely continue lower in the following month. I wouldn’t recommend buying this low of $15,500 (for the long-term) and hoping it’s a false breakdown because that’s gambling. In a bull market, buying retracements has a high chance of success, but in bear markets, breakdowns usually will follow through to the downside.
ETH
Bias: Long-term Bearish, Medium-term Neutral

ETH looks different depending on which time frame you are looking at it from. On the monthly time frame, ETH looks bullish, but on the shorter daily time frame, ETH is quite bearish.
On the monthly time frame, we got a close of the November candle, and during this month, we wicked below the highest close from the 2017 bull market but were able to close strongly above. In the longer-time frame, we got a close retest of important support and closed above it, which is a good sign for bulls holding on. However, there is no direction, and we are stuck trading in the $1,100 to $1,500 trading range in this monthly time frame. This is very hard to trade right now, and I’m still scared that this will just rug and completely dump through the $1,100 support.

The short-term price structure of ETH has remained the same this past week. We are still in the tight high transaction zone between $1,250 – $1,350. We have been rejected at $1,300 three times this week, as shown by the multiple wicks that hit a high of $1,300 and failed. This coincides with the anchored-vwap, representing the average prices traded since the November 2018 lows. Like BTC, we are stuck inside this tight little range with no real direction. If you believe this type of sideways range will continue, use Pionex’s just-released flying-wheel product to take advantage of this scenario. I will give more details below.
3 scenarios ETH
- Break above $1,330 with acceptance of the price (not sold off right after), and we will likely continue this uptrend toward $1,500
- Break below $1,200 with no reclaim of the support, and we will likely revisit the $1,100 lower support of the trading range.
- Stuck between $1,200 – $1,300. Use flying-wheel product.
Recommendation
Flying Wheel Strategy | High Yield – Medium Risk
The Flying Wheel Strategy is highly profitable during potential up-trending or sideways markets. For this product, you have to choose a buy price or a daily percentage drop.
Before you follow this trade, I would suggest a smaller position to test it out before jumping all in. There is a high probability that you WILL get executed and have your stablecoins converted into crypto. So if you are uncomfortable with that, please do not follow this trade.

This time I will choose a daily percentage drop because it is more dynamic and follow the market up or down. I will use it on ETH because ETH currently offers higher returns for a similar % move. Under Pro Mode, I selected a 2% daily drop which will return 96% APY and expires in 1 day. However, your APY will be different depending on when you see this post and the price of ETH at that moment. ETH can easily move 2% in a day, but with the current sideways trading conditions, ETH will likely have minimum movement. Also, $1,200 has been a support level that has been effective in the past 2 weeks and tested as resistance than support. With these factors in my favor, I am willing to take the risk to generate a high yield.

Structured Products | Medium Yield – Low-Risk
BTC prices reached over $17,000, so I closed the BTC-buy-the-dip bot with 2% in profits and opened a buy-the-dip order on ETH, as outlined in last week’s post. As expected, ETH prices did not reach $1,100, and we can receive the generated yield in 2 days. 22% APY, not bad for a low-risk trade.

Next week we have the FOMC meeting on Wednesday, December 14th, which will likely cause market volatility. The safe trade would be opening a buy-the-dip order on ETH for 6 days or less. However, I believe that $1,100 is a strong support level and the probability of us revisiting the lows in the next 9 days is low. So I have opened a $1,100 strike, 9-day duration buy-the-dip order returning 34% APY. However, I wouldn’t invest all my money into this. Instead, I would save some cash to invest after the FOMC meeting to capture the potential increase in volatility and yield on structured products.

Swing Trading (Manual) | Hands-on Approach
Got stopped out of the swing trade. Prices are too choppy. -1.1%

Risk-averse (Grid Bot) | 1 – 12 months: (Sample Portfolio $1,000)
(This is a sample portfolio. Same % gains on a $1,000 or $100,000 portfolio.)
Currently, we are 10% allocated in the market, with a total percentage change of -3.4% overall from -3.1% last week.
If you believe markets will keep consolidating, you could start a grid trading bot near $16,700 – $16,800. I would use a lower range of $16,000, an upper range of $18,500, and 30 grids. Understand that if BTC breaks down from this consolidation range quickly, the drawdown will likely be higher than any profits you have arbitraged with the bot. I will not be starting this bot myself.
Started on 9/7 $18,800. 10% of portfolio allocation.

Hodler (Moon Bot) | 1 – 3 year time frame
None are open currently.
