Major events
11-01 Tuesday
- Reserve Bank of Australia announces interest rate decision
- The final value of the US Markit manufacturing PMI in October. The previous value was 49.9, and the forecast value was 49
11-02 Wednesday
- Bank of Japan release minutes of the monetary policy meeting
- ADP employment in the United States in October, the previous value was 208,000, and the forecast value was 200,000
- Federal Reserve announces interest rate decision at 2:30PM EST
11-03 Thursday
- Bank of England announces interest rate decision
- U.S. ISM non-manufacturing PMI in October, the previous value was 56.7, the forecast value was 56
11-04 Friday
- The U.S. unemployment rate in October, the previous value of 3.50, the forecast value of 3.60
- US non-farm payrolls in October, the previous value was 26.3, the forecast value was 20
Technical
BTC
Bias: Long-term Bearish, Medium-term Slight-Bullish
This week we briefly shot over the $20,700 resistance mentioned in last week’s research, but ultimately bulls could not hold prices above it. The most important level BTC has to get over is the Short Term Holder Realized Price at $21,350 and the 100-day MA at $20,800. The 100-day MA has acted as a reversal point during the previous 3 bear market rallies. It would represent buyer strength if we could reclaim this level and hold above it. The Short-Term Holder Realized Price has acted as a dynamic supply level (selling pressure) in previous bear markets. (Chart 1) If we can reclaim this level, it would give further indication for a continuation of the current rally. (Chart 2)


We also see medium-term moving averages, such as the 50-Day flattening out. (Chart 3) This shows a slowdown in the selling pressure and BTC moving towards a neutral state. In the past week, we saw prices reclaim the 50-Day for the first time in 2 months. Previously when prices moved above the 50-Day, it was still slopped down to a large degree, and BTC could not sustain the rapid change in price momentum. This time the price action looks more sustainable. We need a positive catalyst to continue the current rally; the closest one is the Fed meeting on Wednesday. This constructive price structure signals the short-term uptrend is a solid foundation that COULD lead to a prolonged rally.

SPY
Bias: Long-Term Bearish, Short-term Bullish
Last week SPY reached our $390 initial price target outlined previously. From a price action point of view, the market is up and holding above levels of resistance which is a positive sign. From here, the SPY must hold the $370 level if it wants another leg up toward the ultimate $410 / 200-day MA target. We have outlined the possible scenario below. Our bias is towards the FOMC meeting pushing the markets up, acting as a catalyst fueling the up move towards $410. Then on 11/10, when CPI (inflation) numbers are released, it could be a turning point and catalyst for a move lower. We believe this is the likely scenario but have outlined below what to do if FOMC instead drives markets lower.

If the Fed raises interest rates by 50 bp on Wednesday (very low probability), buy your favorite crypto assets immediately. However, the more likely scenario is the Fed raises interest rates by the expected 75 bp. If this is the case will likely see a drop or sideways movement. The more significant factor will be the guidance given by Chairman Powell at the price conference at 2:30 EST. If Powell says interest rates are working and they are considering raising rates by 25 or 50 bp next meeting, I would immediately buy your favorite crypto asset. This asymmetrical trade means a higher possibility of large profits and limited losses. I will not give guidance on stop levels as we don’t know where prices will be on Wednesday. However, if the Fed kills this narrative and reiterates its stubborn, tough-on inflation stance, I would immediately go short on your least favorite / weakest crypto.
Our View: The direction will be decided in this battle
Starting this week, the market will usher in the most important test at the end of the year. From November 2 to November 10, four major events may affect the ultimate direction of the market.
On November 2, Eastern Time, the Federal Reserve will announce its latest interest rate decision. On November 4, the nonfarm payrolls report for October will bring important information about the labor market and the recession. On Nov. 8, the midterm elections may usher in a change in Congress that will affect cryptocurrency trends and U.S. stocks. Finally, the US will announce the October CPI on November 10, and we will closely track the impact of inflation and the Fed’s policy on the market at the end of the year.
1. The Fed’s November FOMC meeting
On November 2, Eastern Time, the Federal Reserve will announce its latest interest rate decision. The market expects the Federal Reserve to raise interest rates by 75 basis points for the fourth consecutive time. But what we are focusing on is Chairman Powell’s press conference half an hour after the interest rate decision. He will give guidance on the future policy direction and may slow down his aggressive rate hike pace in consideration of the recession.
Previously, the Fed sent a signal through the Wall Street Journal that it was considering a pivot. Last week, the Bank of Canada, regarded as the leading indicator of the Fed’s policy, also began to slow down the pace of interest rate hikes due to recession expectations. But the PCE inflation data released on Friday showed that inflation remained high, and the data still did not support a slowdown in rate hikes. Therefore, if the Fed still gives hawkish future guidance at that time, it will contradict market expectations. Every time the interest rate hike expectations contradict the market expectations, the market responds with volatile moves. We expect a downward move if the Fed stays hawkish in this case.
2. US non-farm payrolls report
Markets now expect U.S. nonfarm payroll growth to slow in October, falling to 190,000 from 263,000 in September. The unemployment rate rose to 3.6% from 3.5%, a near half-century low. The data overall suggest that the labor market remains very strong.
The last September employment report was much better than expected. The S&P 500 was down 2.8% on the day, while BTC followed with a 2.16% decline. If the latest report comes out better than expected again, hopes of a slowdown in Fed rate hikes could be thrown out. If history could repeat itself, further declines are inevitable.
3. Midterm elections
For the US midterm elections, bullish investors may want a divided Congress (bipartisanship). Because the stock market tends to benefit from gridlock in the U.S. Congress. “Risk assets tend to perform best when governments are divided,” Comerica Bank said. Victoria Greene, chief investment officer at G Squared Private Wealth, said, “the market likes the balance of power and political gridlock.”
There are two possible outcomes for this midterm election: 1) Republicans win the House of Representatives and Democrats win the Senate, and 2) Republicans win both the House and Senate. From the observation of past historical performance, in each of the above cases, the annual increase of the S&P 500 index is between 5% and 14%. Regulatory headwinds, fiscal policy, and monetary policy faced by cryptocurrencies will also be more controllable.
4. CPI report
On November 10, the United States will announce the CPI for October. Since suppressing inflation is the Fed’s top priority, the CPI became the most important economic data. Barclay Bank compared the performance of the S&P 500 against 10 major economic indicators and found that risk assets have had the most negative response to the CPI in nearly 10 years. The CPI is a bearish event for stocks, risk assets, and cryptocurrencies. So we will keep a close watch on this number, the impact of inflation and Fed policy on the market.
Recommendations
Structured Products | Generate yield
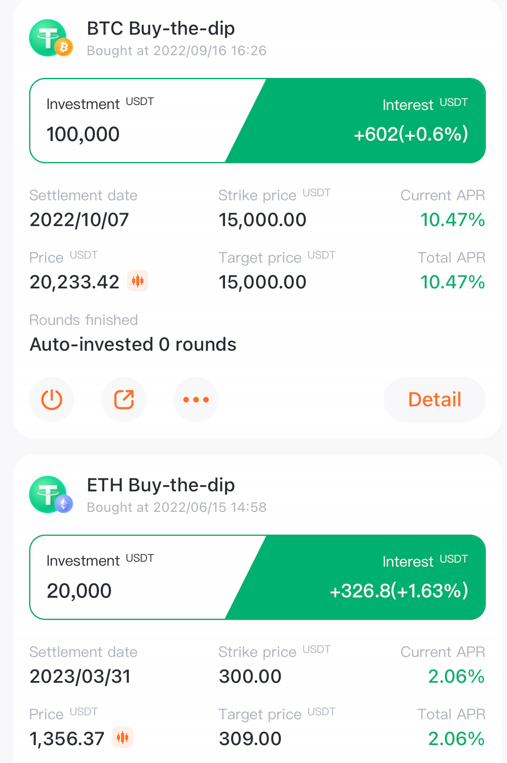
We recommend that readers use the BTC-buy-the-dip bot with a $17,500 or $18,000 strike price and a 4-day to 21-day duration. Only invest in the product that is generating over 10% APY. Currently, the 4-day duration product returns only 4% APY, so we do not recommend purchasing that product. Like last week not much has changed, and I would let the bot continuously generate passive income and reinvest into the selected products. Prices are currently still under $21,000, so we will continue to invest, but over that price, we would recommend stopping the bot and will make a different recommendation next week.

We at Pionex love to use our own products. We only made them because we felt current products weren’t good enough. Here are some orders from our Pionex family!

Swing Trading (Manual) | Hands-on Approach
Conclusion of our swing trade. BTC reached our $21,000 target after our entry of $18,500 last month. We profited 15% on the trade, reaching a risk-reward of 5-to-1. We took profits as earnings from risk on technology stocks were not positive, and many lowered guidance for the upcoming quarter. This, coupled with the Fed rate decision this week, we believe it’s best to take profits and sit on the sidelines.
FOMC Trade Plan
IF interest rate hike <= 50 bp. Then I would go long BTC/ETH/BNB/MATIC big size.
IF interest rate hike >= 75 bp. Then I would wait for the 2:30PM EST Press conference.
IF Powell says they will consider slowing rate hikes for the December meeting. Then I would go long BTC/ETH/BNB/MATIC half-size.
IF Powell says inflation not subsiding will not stop tightening until inflation subsides. Then I would short BTC/ETH/ADA half size.
Manage your stops accordingly. I would probably get out if the trade does not go your way and takes out the day’s lows (if you are long).
Risk-averse (Grid Bot) | 1 – 12 months: (Sample Portfolio $1,000)
(This is a sample portfolio. Same % gains on a $1,000 or $100,000 portfolio.)
Currently, we are 50% allocated in the market, with a total percentage change of +16.8% overall from +13.5% last week. We recommend opening a Grid Bot at $17,500 with 10% – 20% of your portfolio. We would use a $30,000 upper limit and a $10,000 lower limit with 80 grids. We believe BTC might get to $15,000, but we don’t try to catch the bottom but instead average down at good prices.
Started on 6/13 $22,800. 10% of portfolio allocation.

Started on 7/27 $21,400. 10% of portfolio allocation.

Started on 9/7 $18,800. 10% of portfolio allocation.

Hodler (Moon Bot) | 1 – 3 year time frame
Started on 6/19 $1000. 20% portfolio allocation.

Fundamental Analysis
Economic Bites
U.S. 30-year mortgage rates are increasing at an unprecedented rate outside of a 2 standard deviation move calculated from historical data. That is from a low of 2.5% to now almost 7%, calculated from data given by Freddie Mac.

What this means is less and fewer people can afford houses. This, of course, has put pressure on housing prices as it has effectively priced out would-be buyers from the market. Housing is 16% of the U.S. GDP, which will be another factor working against it. Looking at the housing price index, we effectively decreased 0.5% in the past 2 months. This is the largest decrease since the 2009 financial crisis and shows the real effects of tightening by the Fed.

GDP is expected to increase by 2.6% for Q3. After having 2 negative quarters back-to-back, this is a welcomed change. However, digging deeper into the number is not as positive as it seems. QoQ GDP numbers are volatile, and looking at YoY numbers is a less noisy indicator. (Chart 4) Looking into the components that drove the positive growth in GDP numbers, we see the main segments were government spending and net exports. (Chart 5) Both are noisy and give no trading signal. The most important of the 2 segments, consumer spending and business investments, are trending down and show significant headwinds.


Redistribution and A New Bull Market
Furthermore, on-chain analyst Twitter@paulewaulpaul observes bitcoin distribution patterns by visualizing the average wallet size. According to his analysis, the main trend is toward smaller wallets, and now the price trend is inversely proportional to the average wallet size.

Similar to 2018-2019, we are witnessing distribution shifts from large to small wallets. According to data from 2018-2019, when the average wallet size exceeds its moving average for about 6 months, BTC will eventually climb out of the bottom range. And this year, data shows that the average wallet size has already crossed its moving average in mid-year. If history does repeat itself, we are probably about to witness a new round of bull market now.
