- As the market gradually digests the news of a Bitcoin ETF, the bullish sentiment for Bitcoin is gradually fading.
- Japan’s “Yield Curve Control (YCC) program” will have a direct impact on global liquidity, leading to amplified volatility in crypto assets.
- Whales did not increase their positions at $29,000, indicating that the downward trend may not have bottomed out yet.
- According to historical data, Bitcoin’s market capitalization must reach 60% to sustain a long-term bull market, but the current reading is 49.7%.
Trading Recommendation
BTC
With a sudden drop in the markets, we recommend taking advantage of this opportunity as the downside volatility has just increased. This means that there will be higher returns at more critical levels of support. As we talked about above, we recommend using the Buy-The-Dip strategy with structured products, and with this increase in volatility and returns, now is the perfect time. We recommend 3 day, $28,000 strike with an annualized return of 27%. If you want to lock in this high return rate, we recommend 11 day, $27,500 strike with an annualized return of 18%.


ETH/BTC High-frequency Flying Wheel
The ETH/BTC exchange rate has finally started a stable recovery after falling from 0.07 to 0.06. The gradual recovery is ideal for investing in arbitrage financial products. I have followed our “ETH/BTC High-frequency Flying Wheel” strategy on Pionex, trying to allocate 200 USDT at a rate of 0.0632. The trading bot generates an annualized return of 23.7% by profiting from arbitrage opportunities during stable upward movements in the exchange rate. It is still a good time to follow and earn from arbitrage opportunities.

Macro Analysis
Fed’s Easing Stance Weakens, Market Frenzy Subsides
This week, Bitcoin’s performance was lackluster, and trading volume showed a decline. On Wednesday, the Federal Reserve delivered a dovish statement that failed to support risk sentiment. The Fed raised interest rates by 25bps, bringing the federal funds rate target range to 5.25-5.5%, the highest level in 22 years. Additionally, the Fed will continue with its planned tapering of asset purchases. Chairman Powell mentioned the possibility of a rate hike in September if needed, and stated that “it’s safe to say that we won’t be cutting rates this year, and it’s possible we’ll be raising rates and tapering at the same time in the future.”
Currently, Bitcoin’s price remains below the support level of $30,000. The market is gradually adjusting and digesting the news of the launch of a traditional spot Bitcoin ETF led by BlackRock and other institutions. As a result, the bullish sentiment for Bitcoin is gradually fading.
Japan’s Unexpected Move Rattles the Crypto Market
Recently, the Bank of Japan made a slight modification to its “Yield Curve Control (YCC) program,” permitting the 10-year Japanese government bond yield to fluctuate around 0.5%. Consequently, the yield on Japanese government bonds went up. Since the time of the Abe administration, the Bank of Japan has been managing yields to prevent a substantial outflow of the Japanese yen, making it a significant contributor to global market liquidity. Any adjustments in the YCC policy will directly affect global liquidity, and this will likely have a noticeable impact on Bitcoin and other cryptocurrencies, which are among the first to be influenced by such changes.
Fundamental Analysis
Whales Still Holding Back on Purchases
As reported by IntoTheBlock’s on-chain data, the Whale Net Flow to Exchange Net Flow ratio combines the net activity change of significant holders with the net flow on exchanges. The peaks observed on the chart indicate instances of large holders accumulating Bitcoin. Because larger holders generally exhibit more reliable trading habits than smaller ones, keeping an eye on this crucial indicator enables us to analyze how whales are accumulating Bitcoin and provides us with clearer market signals.
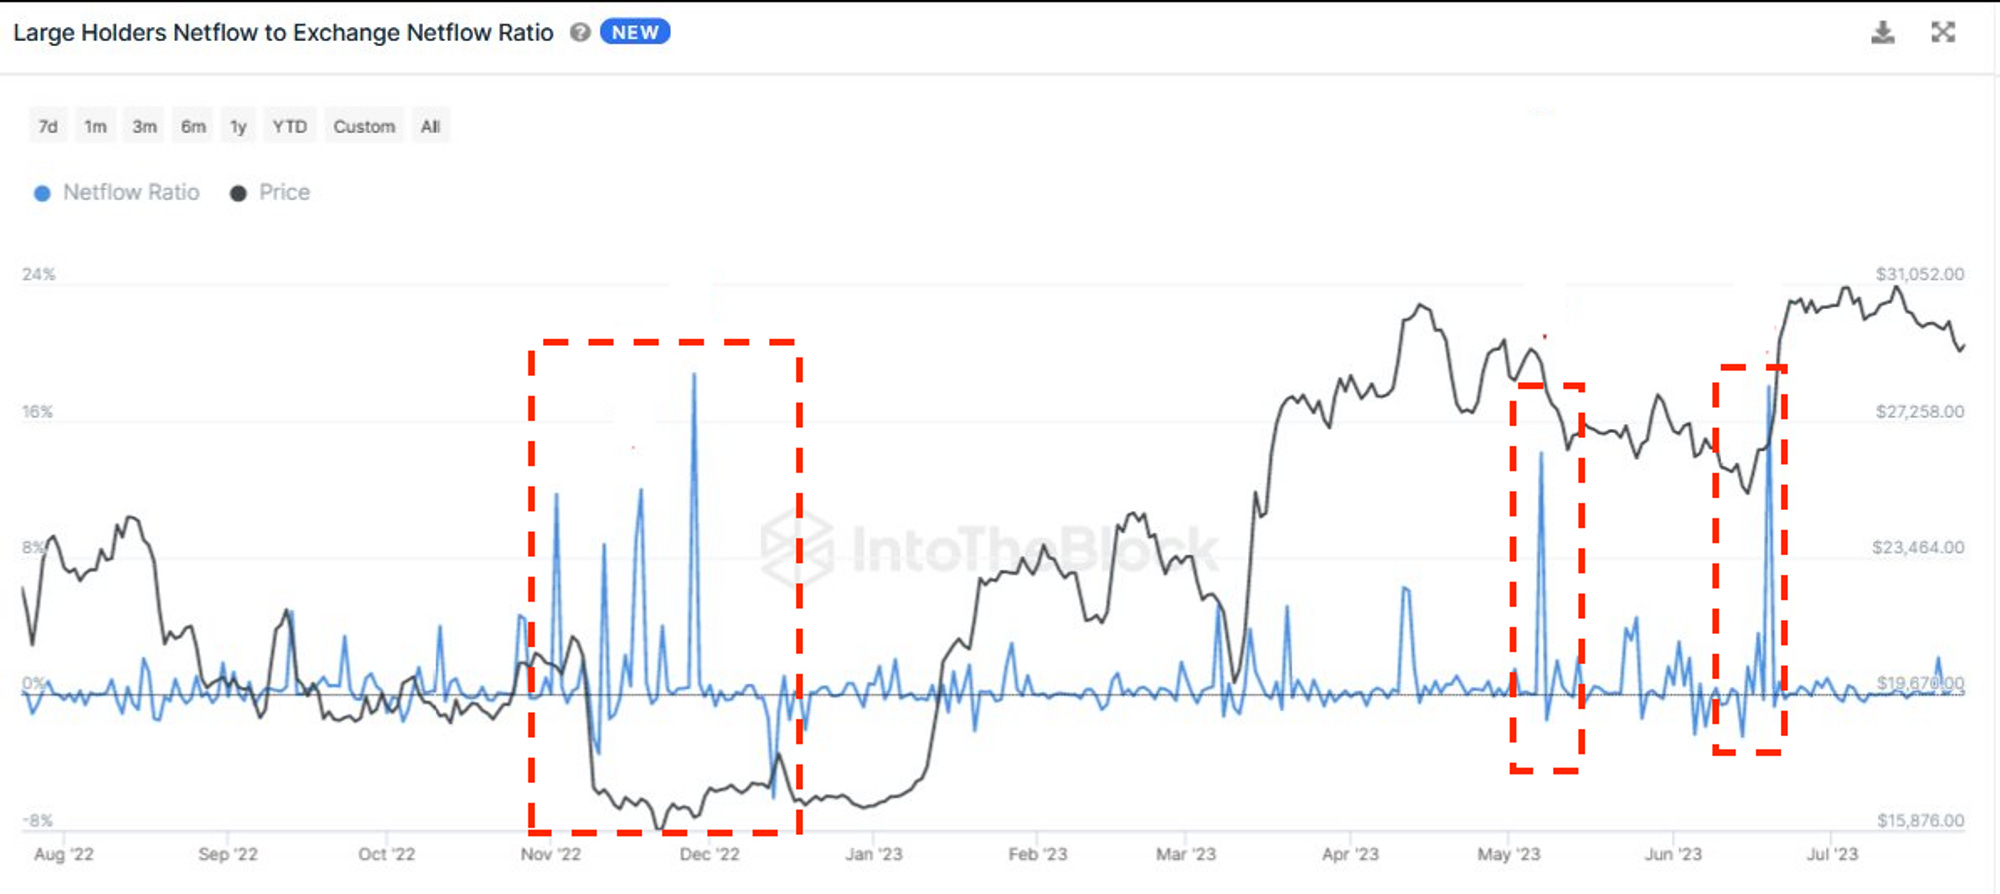
The chart shows a notable surge in whale accumulation during the months of May and June. Interestingly, over the past year, these periods of increased accumulation have almost perfectly aligned with local market bottoms. However, in the current scenario, whale activity has been relatively steady, without experiencing a significant surge even after the price fell below $30,000. This observation suggests that whales might not have added positions at the $29,000 level, or it could also imply that the market downturn has not yet reached its lowest point.
Our Proximity to a Long-Term Bull Market
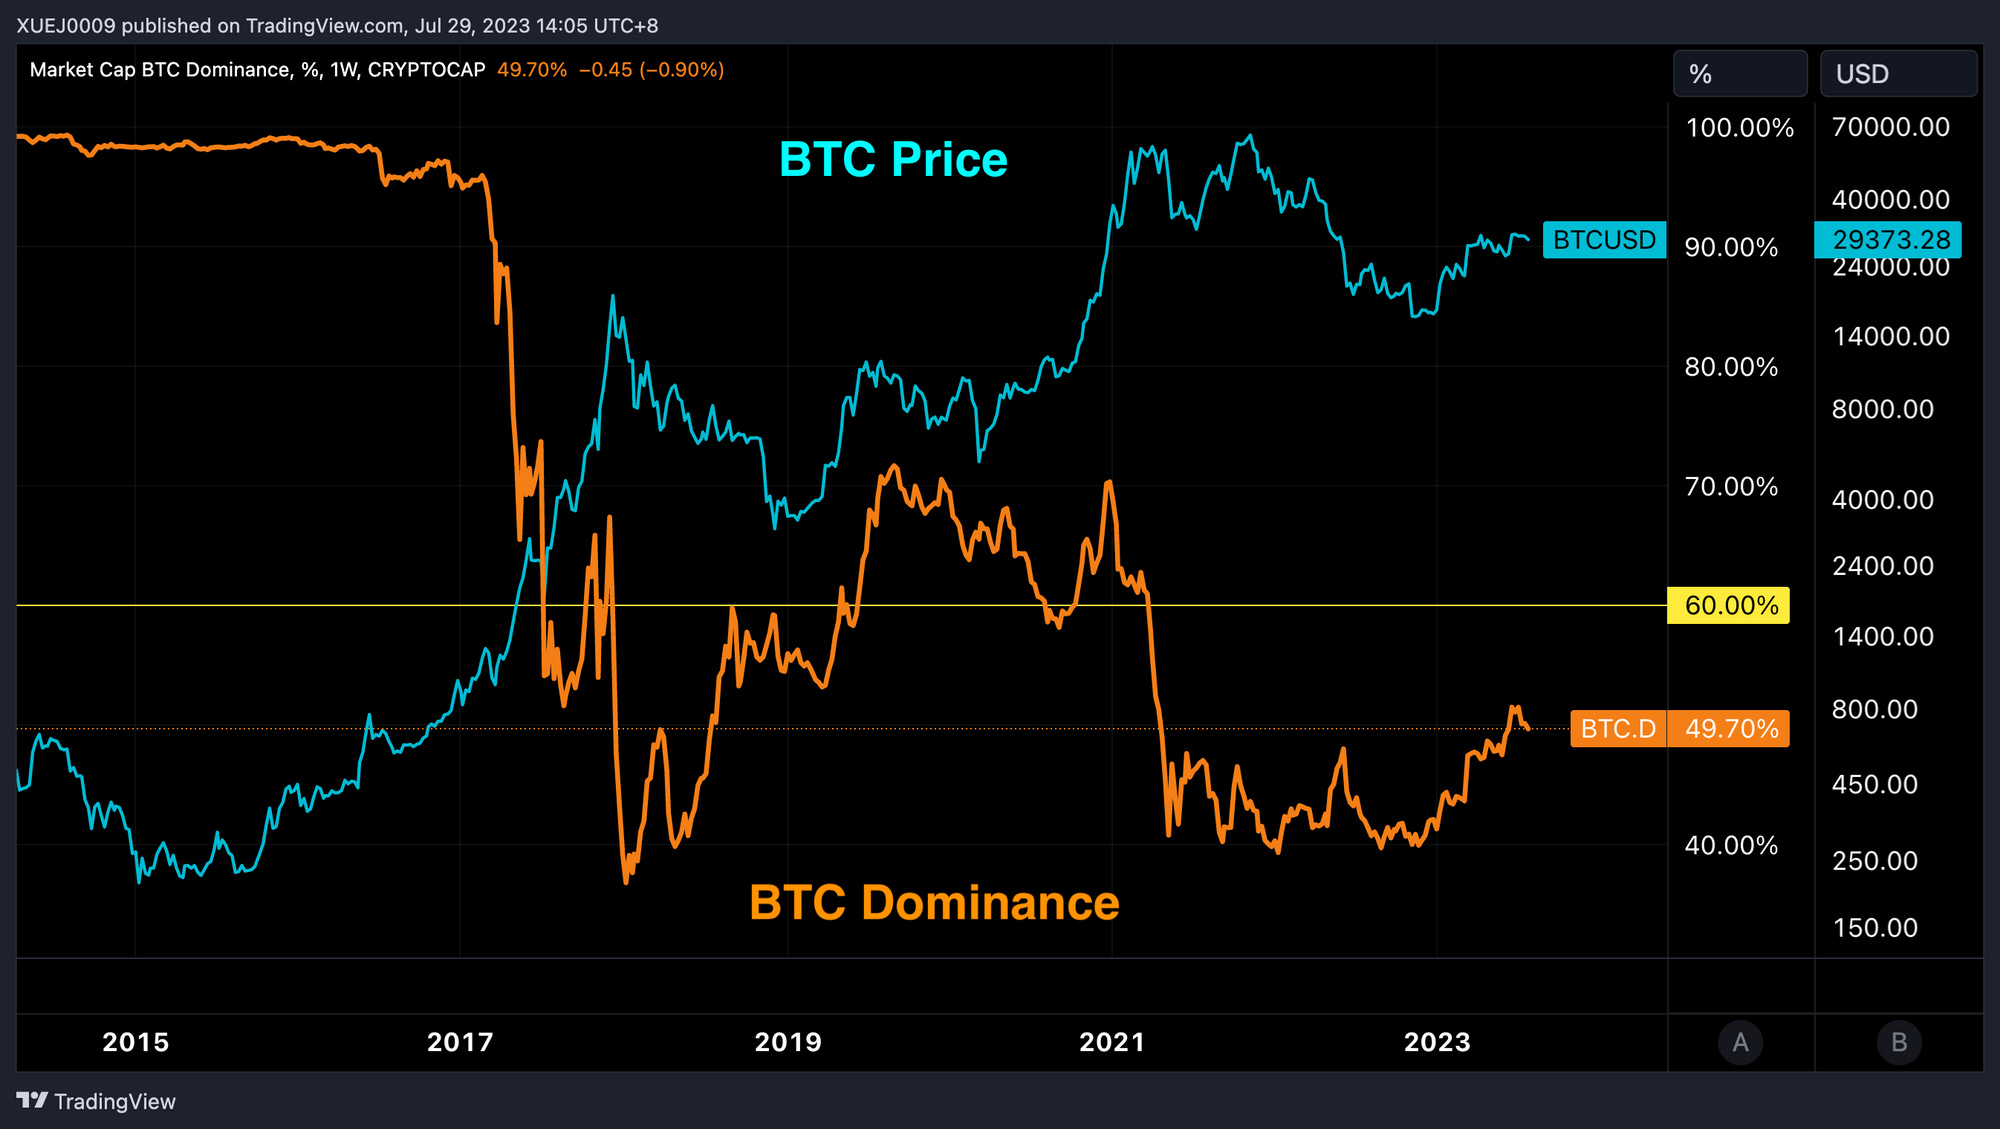
Based on historical data, Bitcoin’s market capitalization needs to surpass 60% to maintain a long-term bull market. However, at the moment, the current reading of 49.7% suggests that we might still be approximately 10% away from entering a long-term bull market if the current cycle continues to follow past patterns.
Technical Analysis
BTC
BTC has been gradually moving to the right side of the chart, seemingly unaffected by any macro headlines or movements in the equities market. The correlations between BTC and key price drivers in the past two years, like DXY, Gold, and Nasdaq, have decreased and turned negative recently. Below is a comprehensive comparison with different assets:
- BTC and DXY (U.S. Dollar Index): Correlation has declined and turned negative.
- BTC and Gold: Correlation has declined and turned negative.
- BTC and Nasdaq: Correlation has declined and turned negative.
This suggests that BTC’s price movements are becoming less influenced by traditional factors that used to drive its value in the past.

The volatility has remained low in the past week, even after the release of the FOMC decision. Although there has been some intraday trading range volatility, the prices eventually returned to the average price at the center of the range. At present, the trading range is even narrower than it was in May, possibly due to institutions and bankers taking vacations during this time of the year.
As we’ve seen from past price movements, these tight ranges make it difficult to predict the future price direction. So, our approach for this week remains similar to last week: we’ll be looking to trade on failed breakdowns or breakouts, as well as monitoring prices moving towards long-term support, like the $28,000 level. However, holding for the longer term could be risky. We previously discussed how to trade this in our previous post linked here. One update is that if BTC breaks down below $29,000 and then reclaims that level, it could present a good short-term trade opportunity. But, it’s essential to be cautious as there are multiple resistance levels above ($29,500 and $30,000).

The volatility curve indicates that the market expects increased volatility and a substantial price surge towards the end of this year and into the next, potentially driven by factors such as the approval of a Blackrock spot ETF for Bitcoin and the upcoming Bitcoin Halving event. Many investors seem to be placing their bets on Bitcoin’s historical 4-year cycle, resulting in a steepening of the vol curve towards late 2023 and early 2024, signifying heightened expectations for larger price movements during that period.

The most successful strategy this year, given the provided information, has been the Buy-The-Dip approach using structured products. If you expect BTC to experience a rally towards the end of 2023 and early 2024, the best course of action right now is to accumulate. Buy-The-Dip is a zero-cost strategy suitable for both retail and accredited investors, enabling them to purchase BTC, ETH, or Altcoins (available exclusively on Pionex) at discounted prices compared to spot prices. If the prices are above the discount price, you’ll receive interest, effectively reducing your average BTC price. Conversely, if prices fall to the discount price, you’ll acquire the coin at the discounted rate. This strategy allows for systematic buying of coins at a discount, avoiding unfavorable levels in a choppy short-term market before the anticipated significant move in 2024.
