Contents
Summary
- Blackrock ETF ticker listed on the DTCC making rounds on Twitter last week, rumored to have driven the price up to $35,000.
- FOMC meeting 11/2 this week.
- Low probability of revisiting under $30,000. Preferably, we don’t go below $32,000 again. That would show strong strength for Bitcoin.
- Consumption may not continue in the coming quarters against a backdrop of stagnant or even shrinking incomes, and high interest rates will have a material impact on the U.S. economy.
- Leveraged futures trading remains prudent, especially at high multiples.
- More people are choosing to buy and hold Bitcoin as the total market value of the currency remains stable.
Technical Analysis
Bitcoin
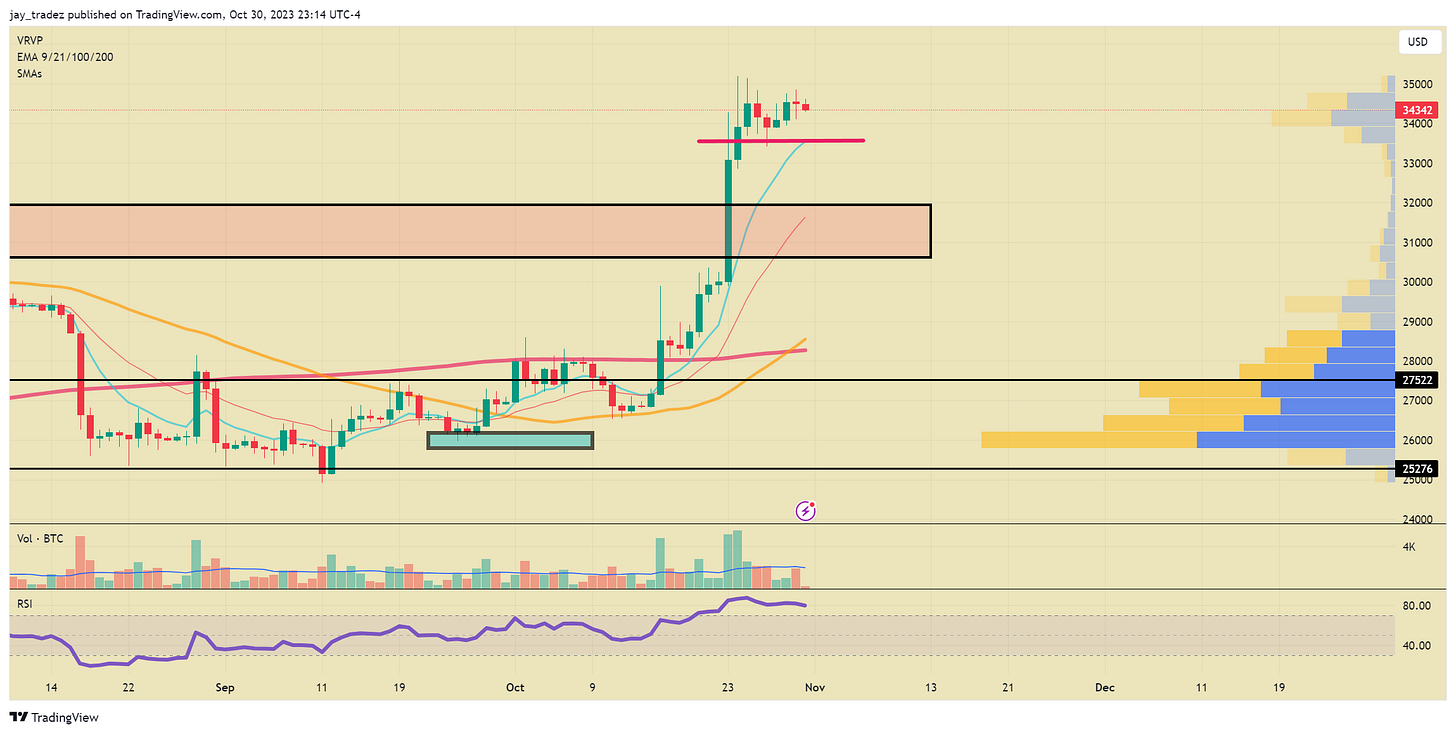
Last week, we wrote that the bullish narrative was developing for Bitcoin, and on Monday, we had one of Bitcoin’s famous outsized candles completely breaking through all resistance and levels of importance. This completely changed the chart and officially put us back into bullish territory. The magnitude of this breakout underscored the substantial capital reserves waiting to enter the market and the resulting fear of missing out (FOMO) sentiment among investors. Some of the move could be said to be affected by the news that a Bitcoin ETF ticker from Blackrock, IBTC, was added to the DTCC’s website, showing further steps in the groundwork being done awaiting a full SEC approval. However, it was said that this was actually added in August of this year but only just started to circulate on Twitter before the $32,000 → $35,000 move.
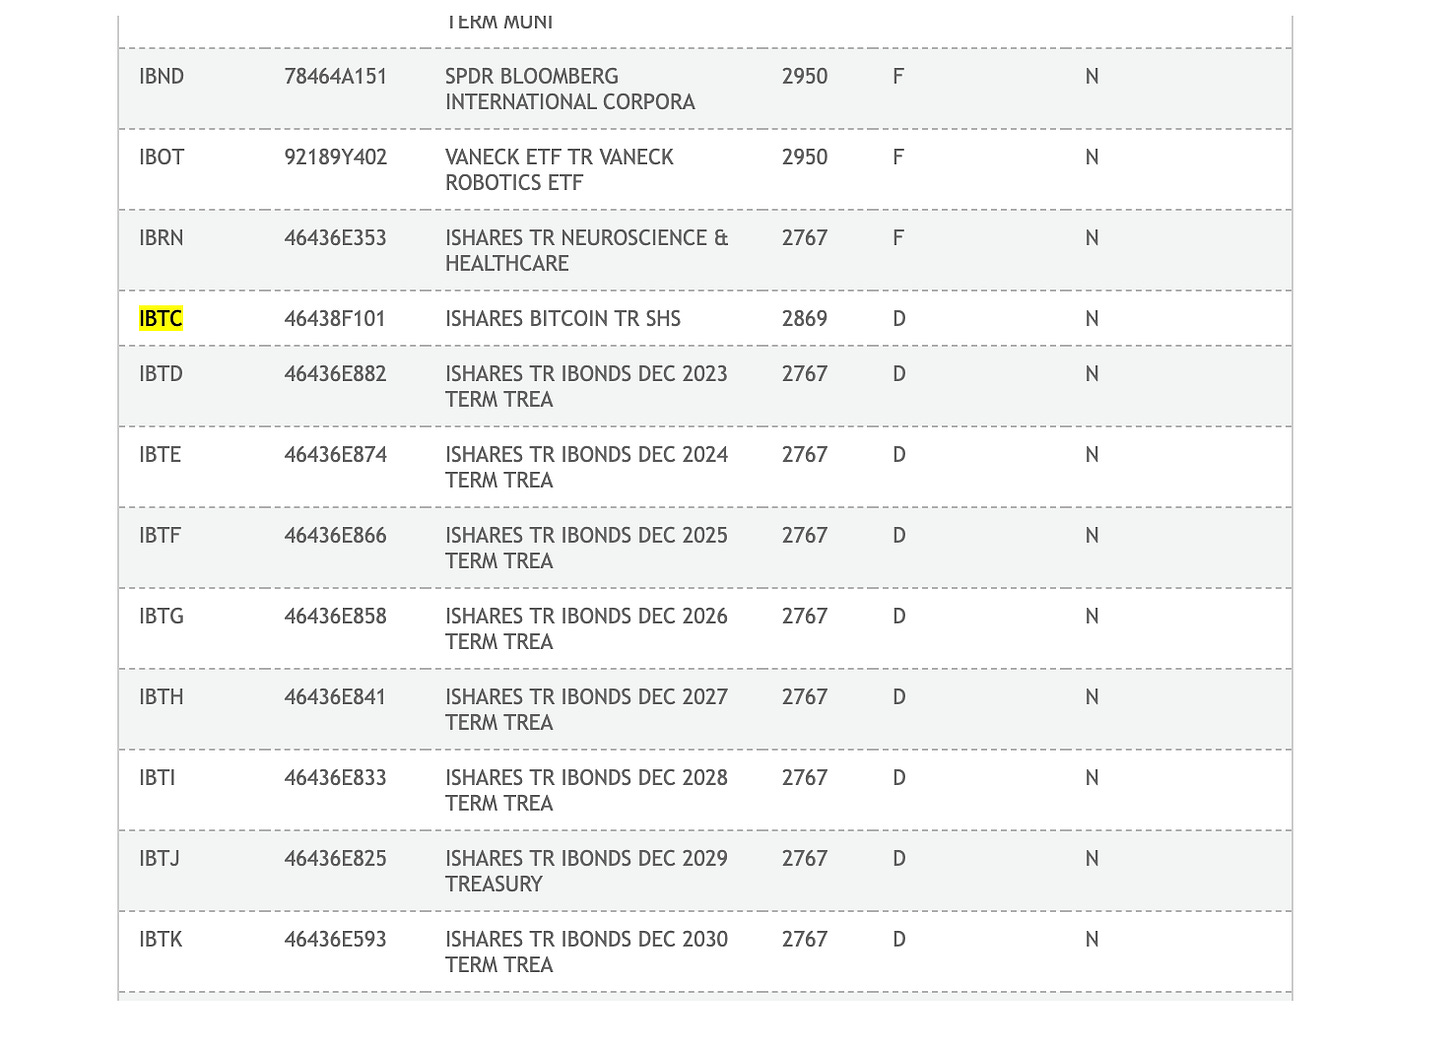

Blackrock came out and said a ticker being listed in the DTCC does not guarantee ETF approval. It is just groundwork being done in anticipation, as Blackrock does for all ETF applications. However, even after that clarification, it didn’t prevent sidelined capital from flowing back in, just further supporting our case of this rally being from FOMO traders.
The weekly candle just closed, and the spread of the candle (low → high) was increasing with increased volume. This is a clear, bullish technical signal. In addition, both the 50 and 200 MAs are angled up, which shows us the direction of the general trend. RSI is just hitting overbought, which on higher timeframes actually could represent that a strong trend is forming (ex. 10/2020).
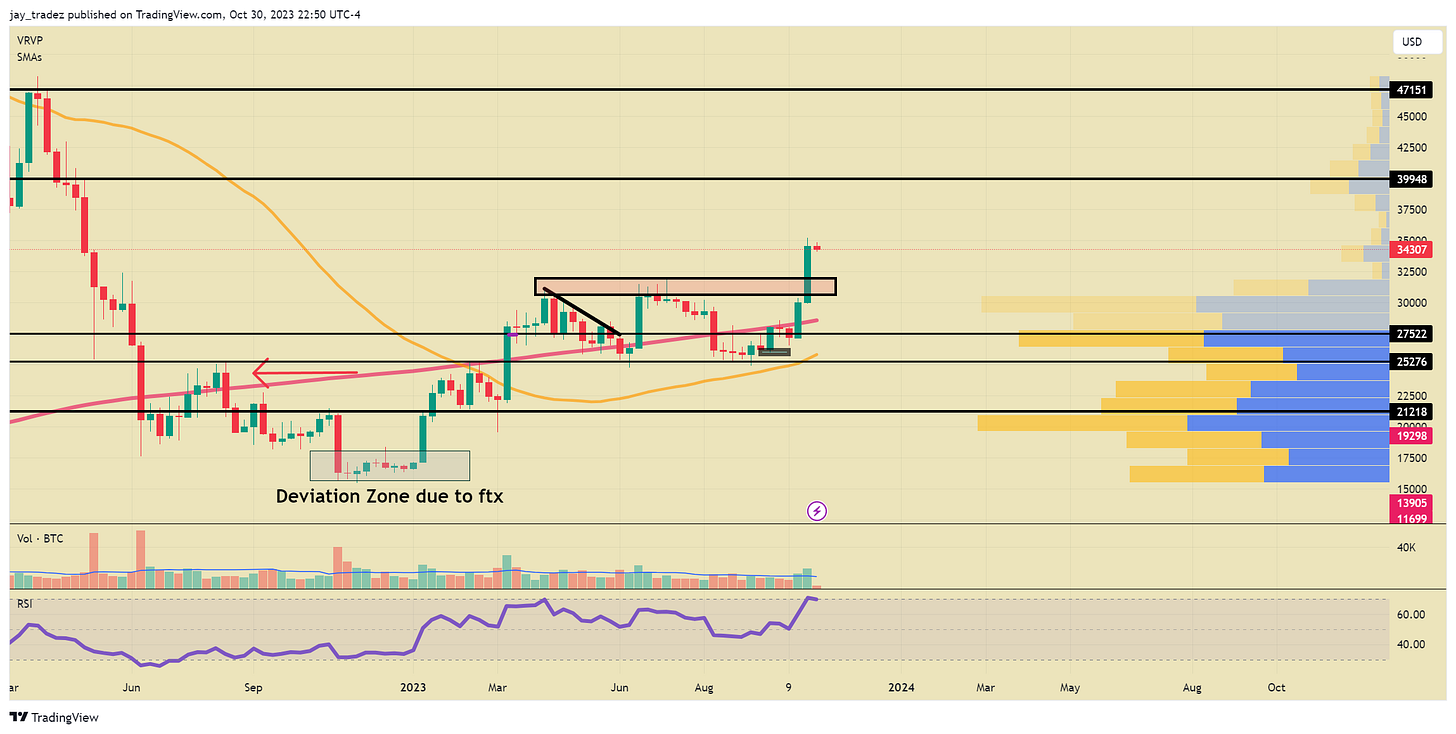

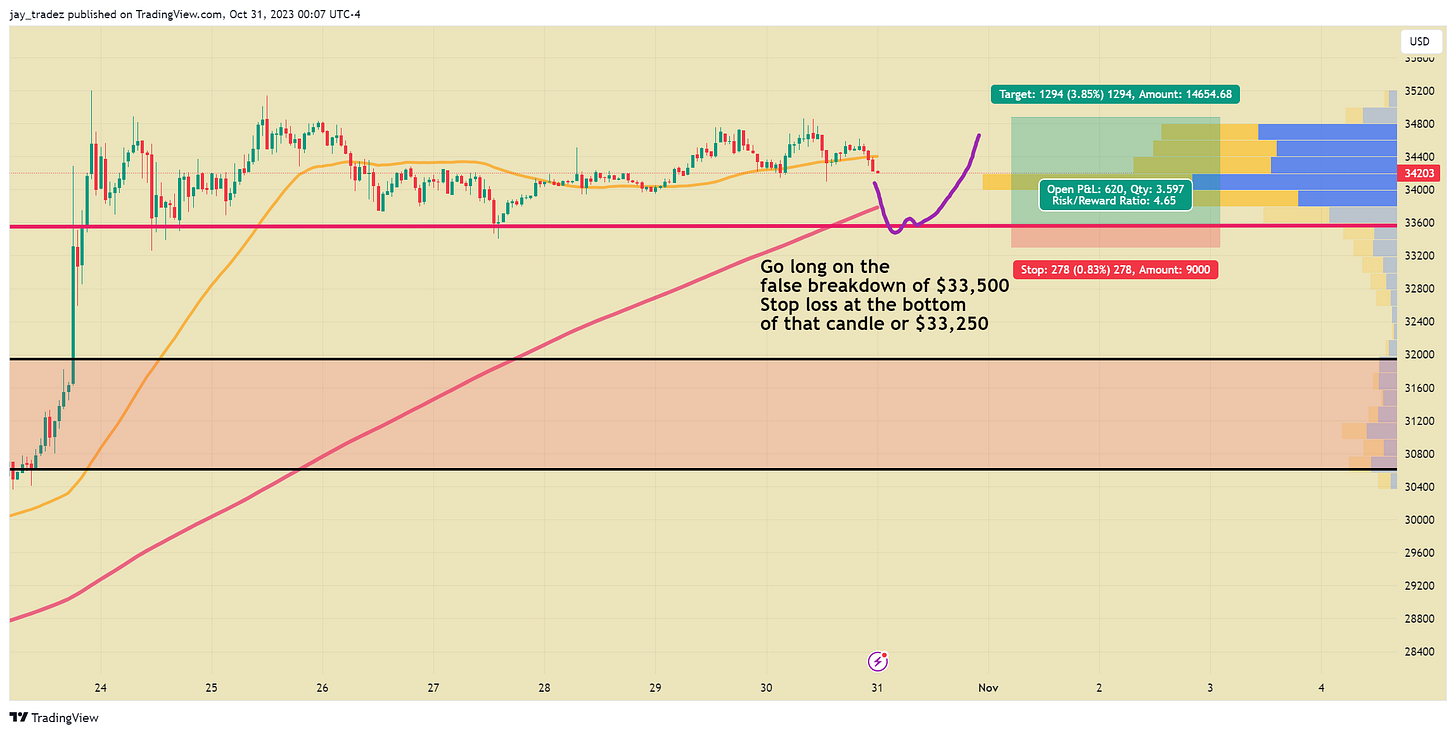
In the present market environment, we maintain a bullish perspective and believe there’s a high likelihood that Bitcoin will not dip below $30,000 again. On the daily timeframe, it currently looks like a bullish consolidation pattern, but trying to predict the short-term direction inside of this consolidation is a fool’s game. So what we would like to see and some possibilities here are a break of $33,500 and reclaim on shorter timeframes such as the hourly chart. In that scenario, going long would result in good risk-reward. The other option is to wait for a daily break and close above $35,000. If this has followed through, we are looking at $40,000 resistance next. However, like all breakouts, there is a possibility that it is a fake breakout and could trap longs.
Overall, we don’t want to see the price break below $32,000, as that is the long-term resistance area and the previous 2023 high that we just broke out from. Going below $32,000 would ruin the price structure breakout. However, if you really want to give it some room, $30,000 could be the final support to watch, as it was the short-term resistance we broke out from. Although we give it a very low probability, in the off chance prices get under $30,000, we will revisit $25,000 and likely go under. All the FOMO buyers would be in the red, and the whole narrative would be broken.

SPX / NDX
It’s not hard to notice the growing unease in the markets. Last Friday marked an official entry into correction territory for the S&P 500, as it tumbled more than 10% from its 2023 peak. The Nasdaq fared even worse, down by over 12%, while the Dow Jones experienced its most challenging week since the banking crisis of March.
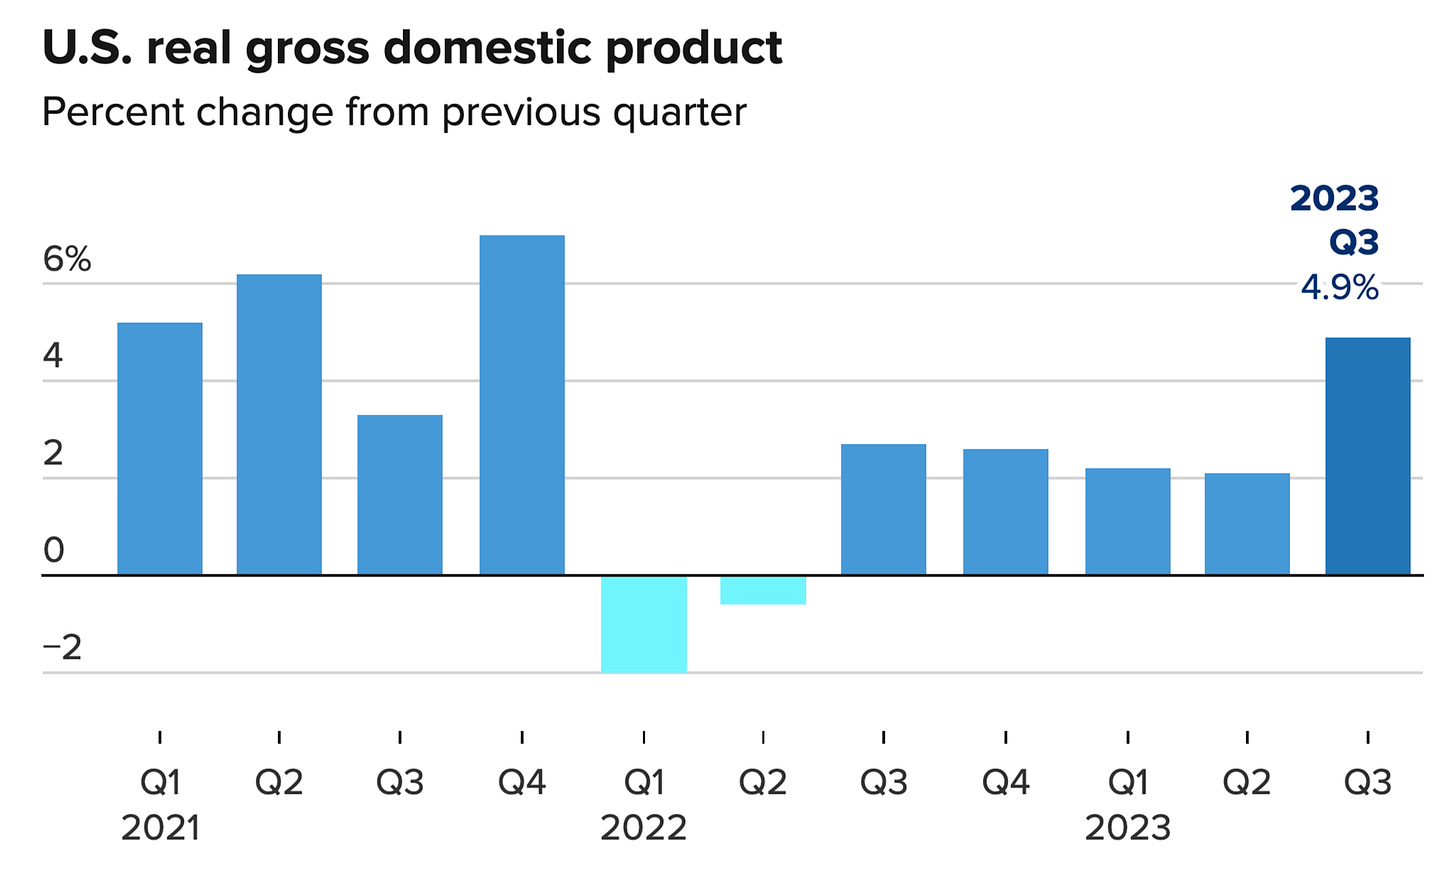
The latest University of Michigan survey showed a notable drop in consumer sentiment and consumer expectations. Given that consumer spending was one of the main drivers in the increase in real GDP. (Report)
The chart below illustrates the relationship between Nasdaq price movements and the percentage of Nasdaq-listed stocks above their 200-day simple moving average (SMA). It reveals a consistent decline in the positioning of mid and small-cap stocks dating back to the first quarter of the year.
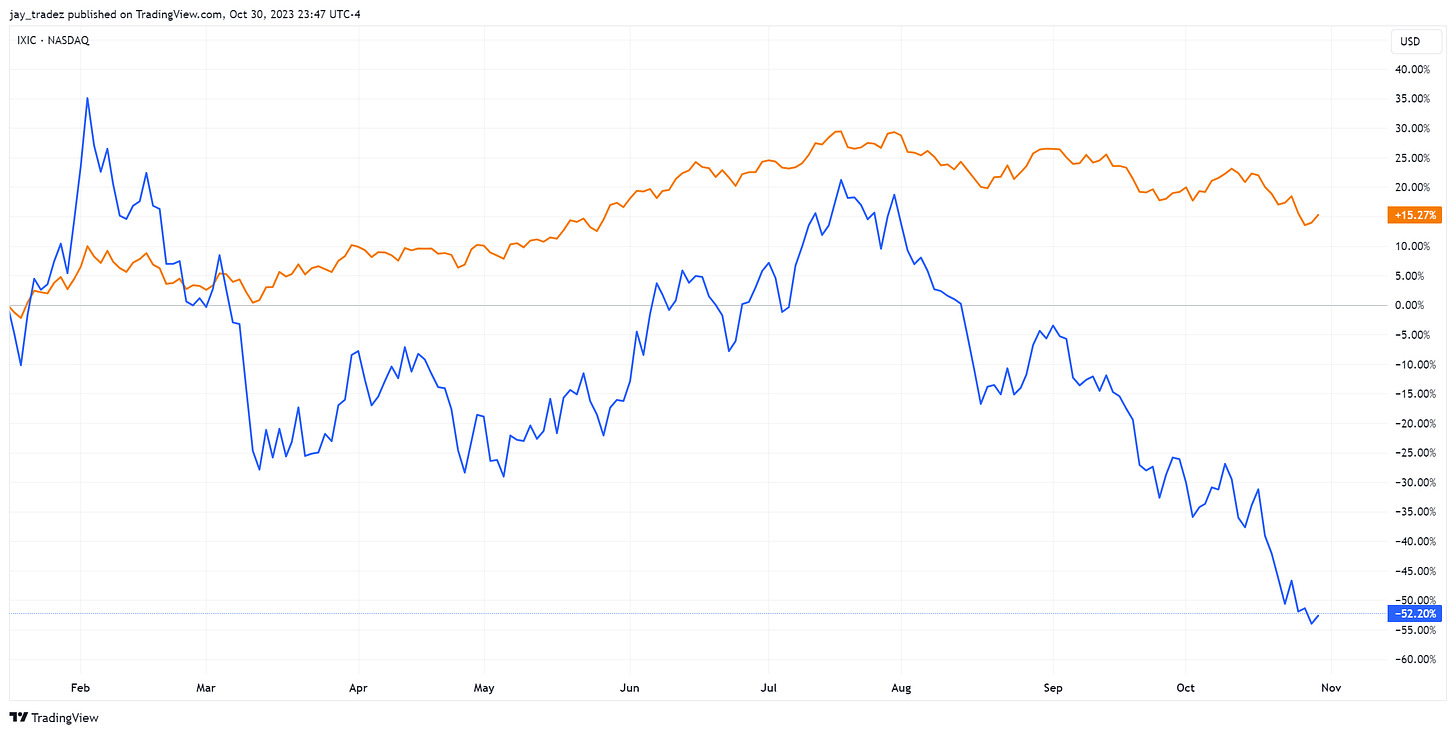

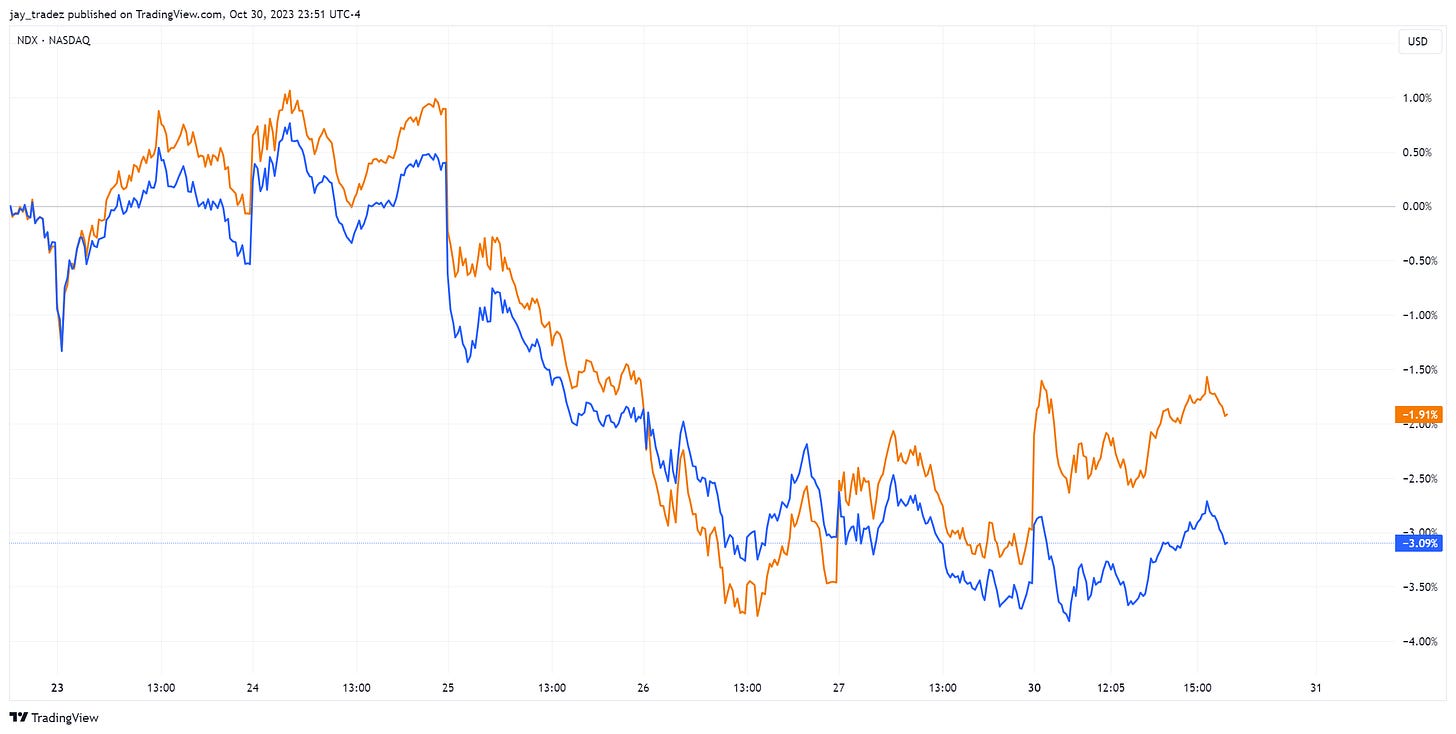
The majority of capital in the index is concentrated in what we could call the “Magnificent 7”(comprising Meta, Amazon, Google, Nvidia, Netflix, Microsoft, and Tesla). However, with companies like Google and Tesla reporting disappointing earnings, the entire index is taking a hit. When we compare the Nasdaq100 to its equal-weight counterpart, we observe that the equal-weight index performs no better than its regular version. This implies that the downturn in the Magnificent 7 is negatively affecting the sentiment across the entire index.

Macro Analysis
Inflation Returns, When to Cut Rates?
Last Friday’s release of the US September core personal expenditures (PCE) came in at an annualized rate of 3.7%, aligning with market expectations. The core PCE, which serves as the Federal Reserve’s preferred inflation gauge, offered some noteworthy insights:
- The U.S. Core PCE price index displayed a monthly increase of 0.3%, surpassing August’s 0.1% and marking the most substantial monthly rise in four months.
- Personal Consumer Expenditures (PCE) rose by 0.7% MoM in September, surpassing expectations for a 0.5% increase, as opposed to the prior 0.4% increment.
- Personal income growth fell from 0.4% to 0.3% YoY in September, which was below expectations and also lower than the 0.4% increase in the Consumer Price Index (CPI) for the same month.
Key Takeaways from the Report:
- Inflation persists and is on the rise.
- Despite robust consumer spending, income levels are contracting.
The Robust U.S. Economic Landscape
The U.S. economy outperformed expectations in the third quarter, achieving its fastest growth rate in nearly two years. This underscores the economy’s resilience in the face of elevated interest rates.
According to preliminary data, the U.S. GDP expanded at a rate of 4.9% in the third quarter, exceeding economists’ forecasts of 4.3%. This growth was driven by strong consumer activity despite the backdrop of rising interest rates, sustained inflationary pressures, and various domestic and global challenges. This was a notable increase from the 2.1% growth seen in the second quarter and represents the strongest figure since the fourth quarter of 2021.
The Fed raised interest rates at the fastest pace since the early 1980s and also said it would keep them high until inflation returned to acceptable levels, but GDP still grew. Although the inflation rate has declined, at least in recent months, prices have risen well above the central bank’s annual target of 2%.
While the PCE and GDP figures may not alter the monetary policy outlook, they raise concerns about the sustainability of the consumer trend in the upcoming quarters. The backdrop of stagnant or shrinking incomes and persistent high interest rates could significantly impact the U.S. economy. We will closely monitor this situation as it develops.
Fundamental Analysis
Surging Prices: What Lies Ahead?
1. Exchange Bitcoin Stock
The value of cryptocurrency exchange stocks is intricately tied to the inclination of users to retain cryptocurrencies within the market. A surge in exchange stocks suggests that Bitcoin holders are depositing their cryptocurrencies into exchange wallets with the intent to sell them for cash. Conversely, a decline in exchange stocks indicates that the public is moving their cryptocurrency assets to off-exchange wallets, signifying a heightened willingness to hold them long-term. This long-term commitment bolsters the cryptocurrency’s price.
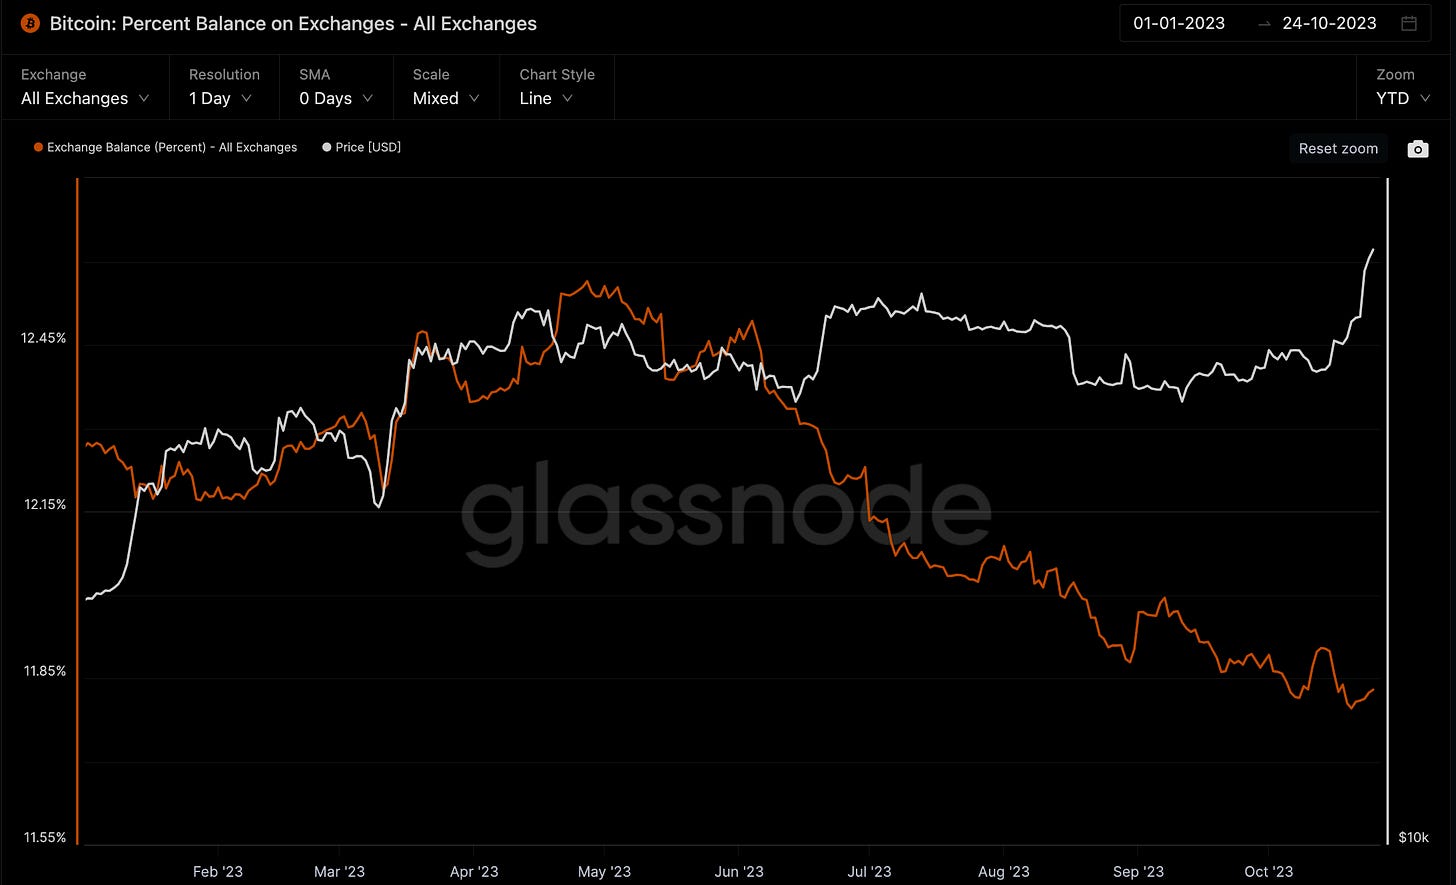

According to data from Glassnode, the balance of Bitcoin stock on exchanges has exhibited a consistent downward trend since May. This trend underscores an increasing desire to hold Bitcoin for the long haul, resulting in a reduction of available Bitcoin for sale. This aligns with the diminishing market selling pressure, indicating investor optimism regarding future Bitcoin price increases. Investors are gradually accumulating cash positions, which serves as a positive bullish signal. However, recent data shows a slight uptick, suggesting the accumulation of some short-term selling pressure.
Simultaneously, the decrease in market supply means that even a modest increase in demand can lead to rapid price spikes. In this context, we advise caution, especially when engaging in leveraged futures trading, particularly short positions at high multiples.
2. Stock of Exchange Stablecoins
An increase in the stock of Exchange Stablecoins signifies that more investors remain on the sidelines, refraining from fully entering the cryptocurrency market. This implies a bearish sentiment as investors are selling their tokens and exchanging them for Stablecoins. Conversely, a decrease in the stock of Stablecoins indicates that more investors are converting their Stablecoins into tokens like Bitcoin and Ether, which is a bullish market signal.
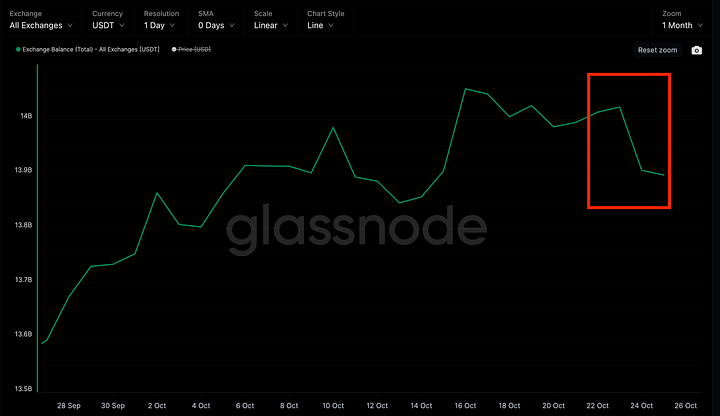

Currently, the total market capitalization of stablecoins is approximately $122 billion, with USDT and USDC making up nearly 87% of this total. Recent data regarding exchange stablecoin stocks shows significant decreases in both USDT and USDC, indicating a strong bullish sentiment in the market.
Exchange data suggests that market sentiment remains optimistic, with the overall market value of stablecoins staying steady. More individuals are opting to buy and hold Bitcoin, resulting in a slight decline in stablecoin stocks and a marginal increase in Bitcoin stocks. Time will tell if this trend continues, and we will keep you updated with the latest data interpretations.
Trading Recommendations
Bitcoin
Futures | Spot
One short-term trade that has a great risk and reward and a good chance of success is the scenario we laid out in the Technical Analysis section. On the false breakdown of $33,500, go long when prices close above on the shorter time frame charts (5 min – 1 hour). Your risk is $33,250 or the bottom of the false breakdown low. The 1st target is $35,000, giving you a 4.5 to 1 risk-to-reward. However, you can hold for the breakout of $35,000 if you like.

Structured Product
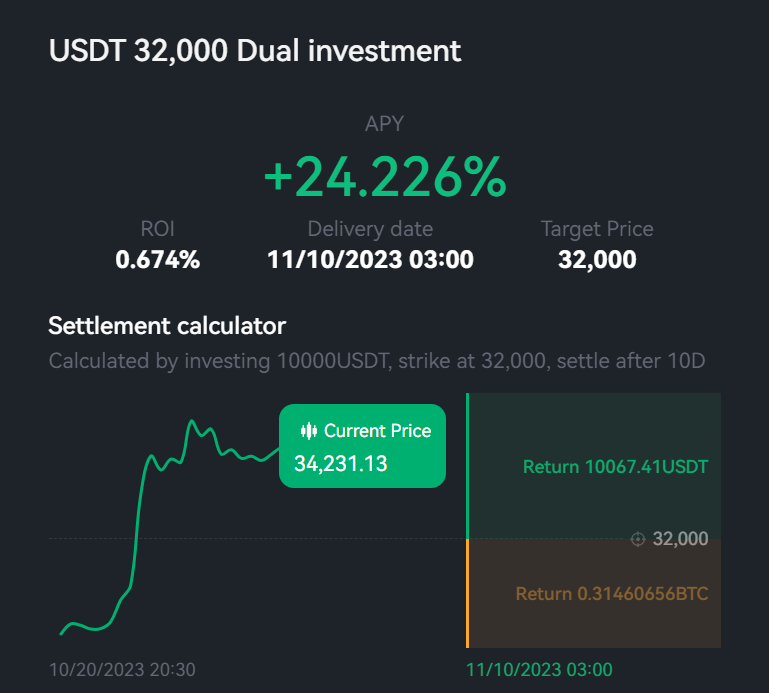
Last week, we suggested $28,000 buy-the-dip, which ended in profit as we are far away from the strike level now. For those who are more aggressive and want a high yield, we suggest a $32,000 Buy-The-Dip with a 5-10 day duration. $32,000 is the previous 2023 top that Bitcoin has to hold, and we believe this would be the first strong support.
For those who are more conservative and sitting in cash, I would suggest a $32,000 strike Buy-The-Dip but expiring on 11/02/2023. You don’t want to hold through FOMC, which is 11/02/2023 this week. Also, this way, you can make a premium while also re-purchasing more Buy-The-Dip after the FOMC, which usually brings in volatility and, thus higher returns.


