Contents
Abstract
- Blackrock CEO Larry Fink says Crypto could be a “flight to quality.”
- The rapid rise in the US CPI for the second consecutive month in September continues to support the Fed to keep interest rates high.
- CPI data for the next few months will likely pick up the slack from PPI, making the Fed’s “last mile” in the fight against inflation particularly long.
- 10-year U.S. bond rates surged 5%, directly suppressing all risky asset prices.
- The better the economic data, the more the market will move to tighten financial conditions further, increasing the certainty of a hard landing.
- The equities market is under pressure, giving up all the gains it had recouped in the past 2 weeks due to higher rates and the potential contagion of the Hammas-Israel war.
- SEC drops charges against Ripple executives.
Technical Analysis
BTC
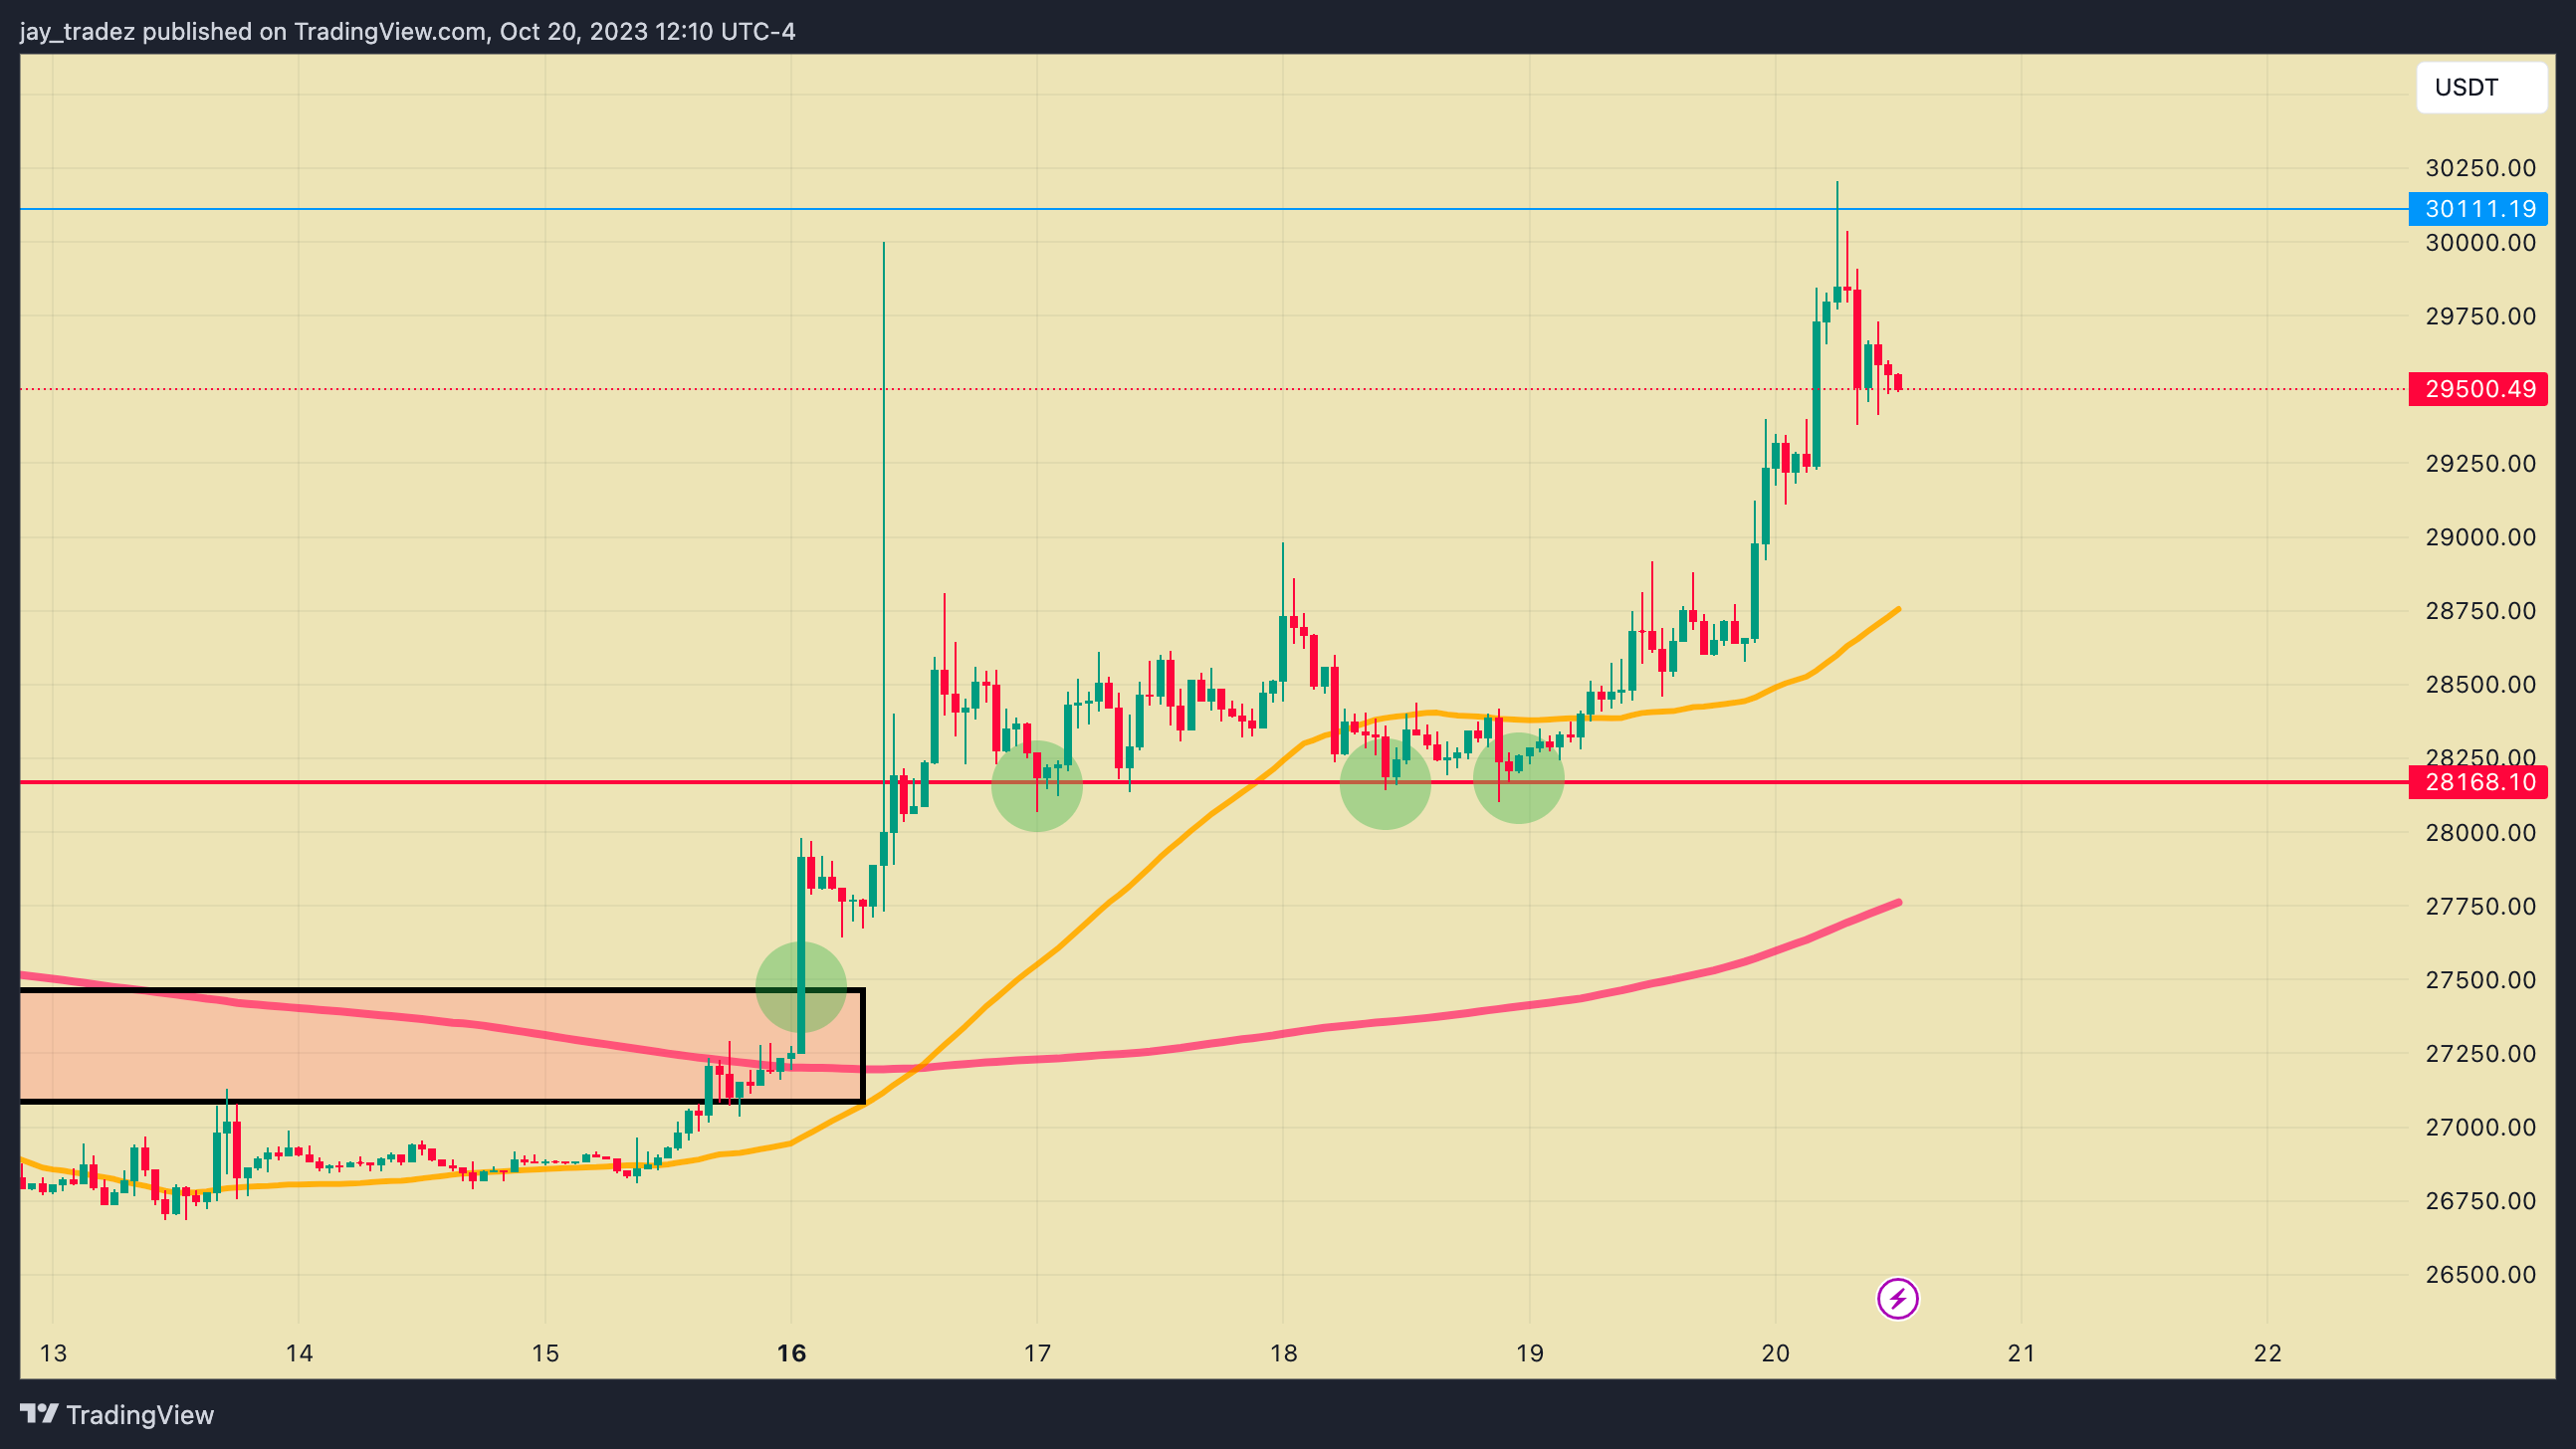
A lot happened in the past 2 weeks, and we will closely review the price dynamics in today’s research. Bitcoin prices hit $30,000 in the past week due to Cointelegraph and Benzinga’s false news release about the Blackrock Bitcoin ETF being approved by the SEC. This resulted in over $100MM liquidations in the overall crypto market, forcing both longs and shorts to be squeezed out.
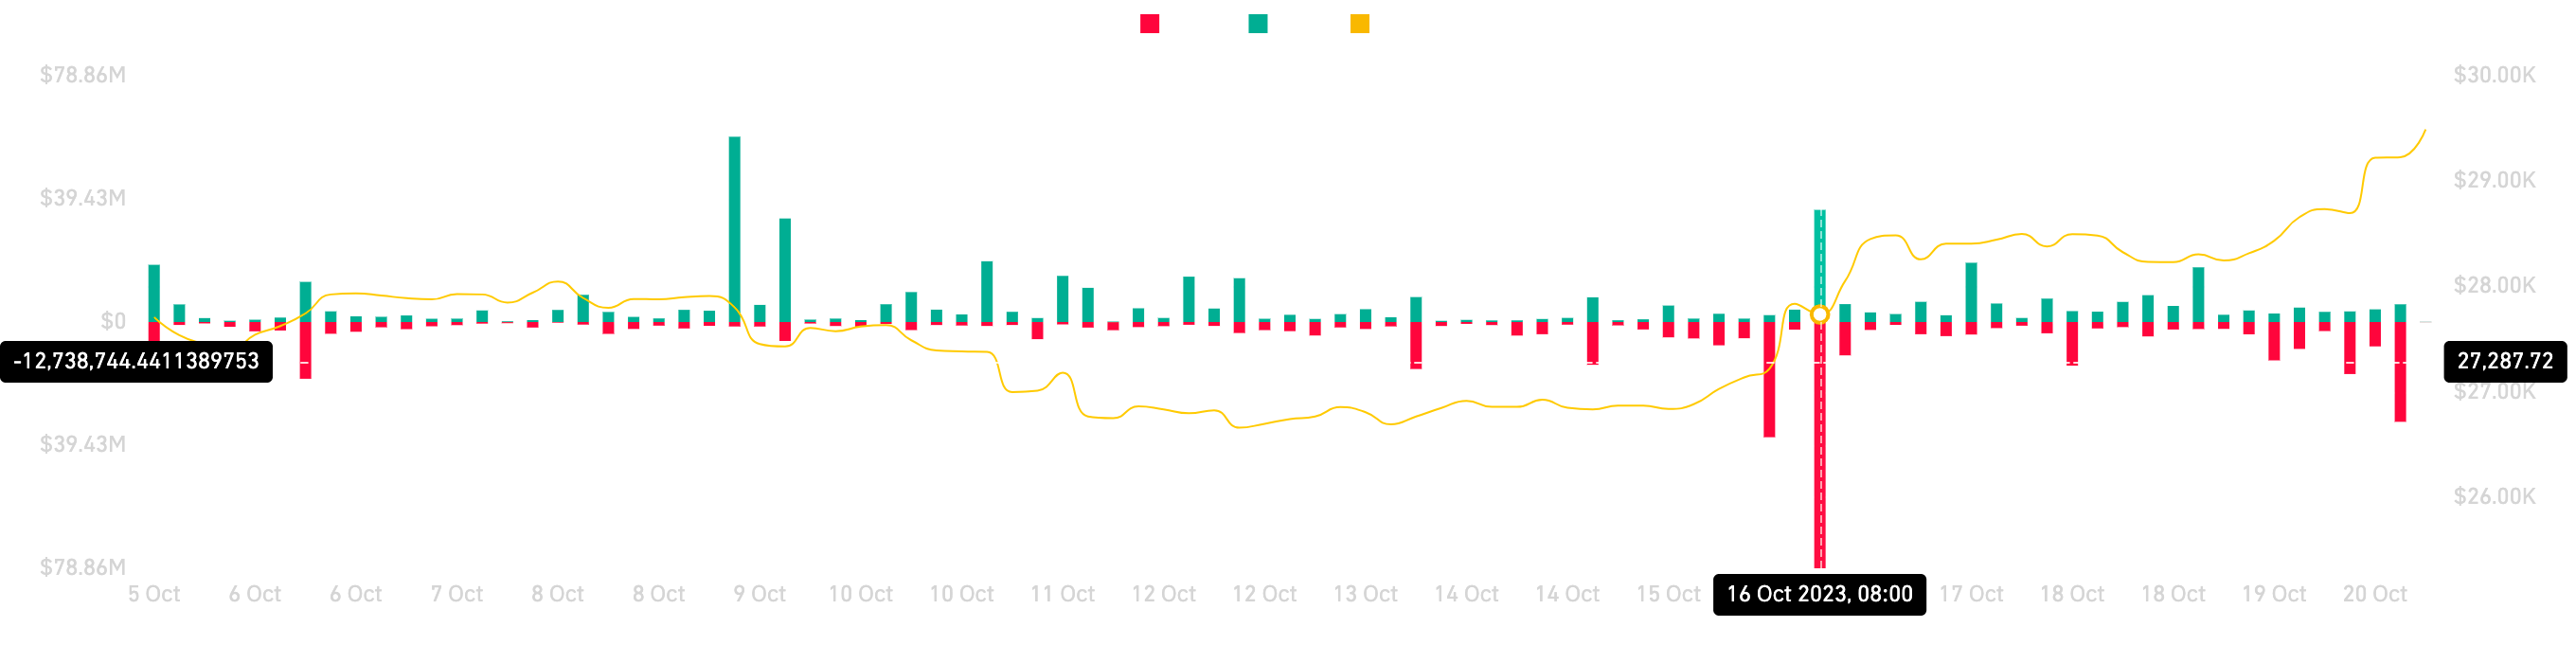
Even though the Bitcoin ETF approval was fake news, Bitcoin had a strong breakout over $27,000 and the important $28,000 resistance level, showing strong demand. What was surprising was that buyers did not leave the market after the news was confirmed fake but supported price at ~$28,000. For us, this is very bullish on a price structure view, and $28,000 is a clear level of invalidation for our bullish view. Nothing has fundamentally changed in the Bitcoin narrative, but we are seeing strong demand as prices are being bid up, which is magnified by the fact that this whole move was driven by false news. From our view, this could be due to traders with stablecoins ($16 Billion) sitting on exchanges, seeing how many people are waiting to build a position in Bitcoin at the first sign of positive news. We saw firsthand how much strength came in, so we believe more traders are scared to miss the move and instead just pre-building a position.
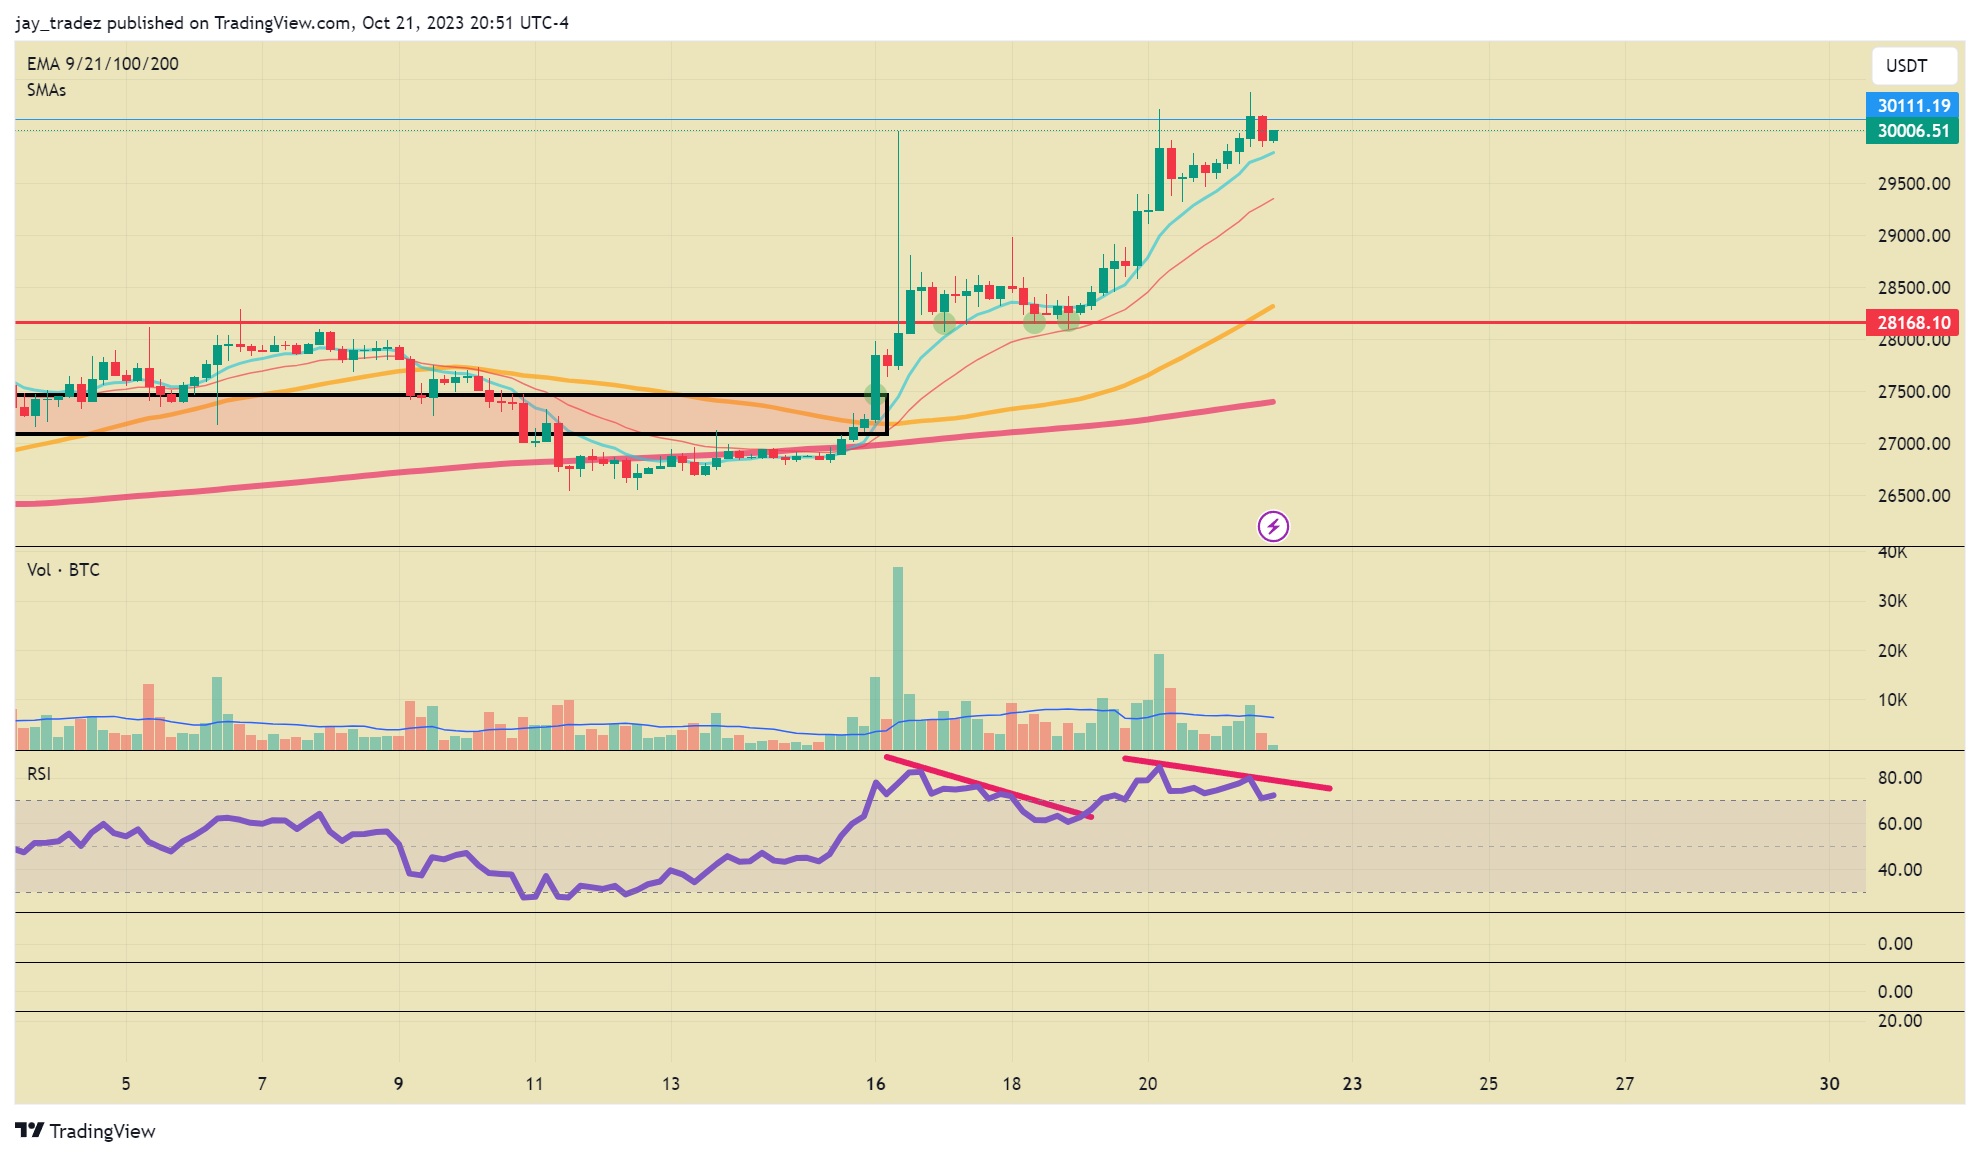
Zooming out to the 4-hour chart, we can see a bearish divergence on the RSI currently and over the last couple of days. Bitcoin invalidated the first divergence and is currently testing the second divergence while at the $30,000 resistance. Usually, this would be a defining bearish signal, but Bitcoin has tested the resistance 3 times so far, with each test having a decreased drawdown, showing strength. Due to this, we don’t recommend shorting prematurely into it until we see how the price reacts to the level. People like Blackrock CEO Larry Fink have been fueling the rally with his belief that Bitcoin could be a “flight to quality” narrative (Link). However, it is yet to be seen if this will play out or if Bitcoin will sell off as a high beta risk asset in the case of a broad equity market sell-off. If BTC moves counter to equities in this sell-off and proves to be a safe-haven asset (like in March 2023 during SVB), then we believe that will mark the start of a major multi-month BTC bull market.
SPY / QQQ
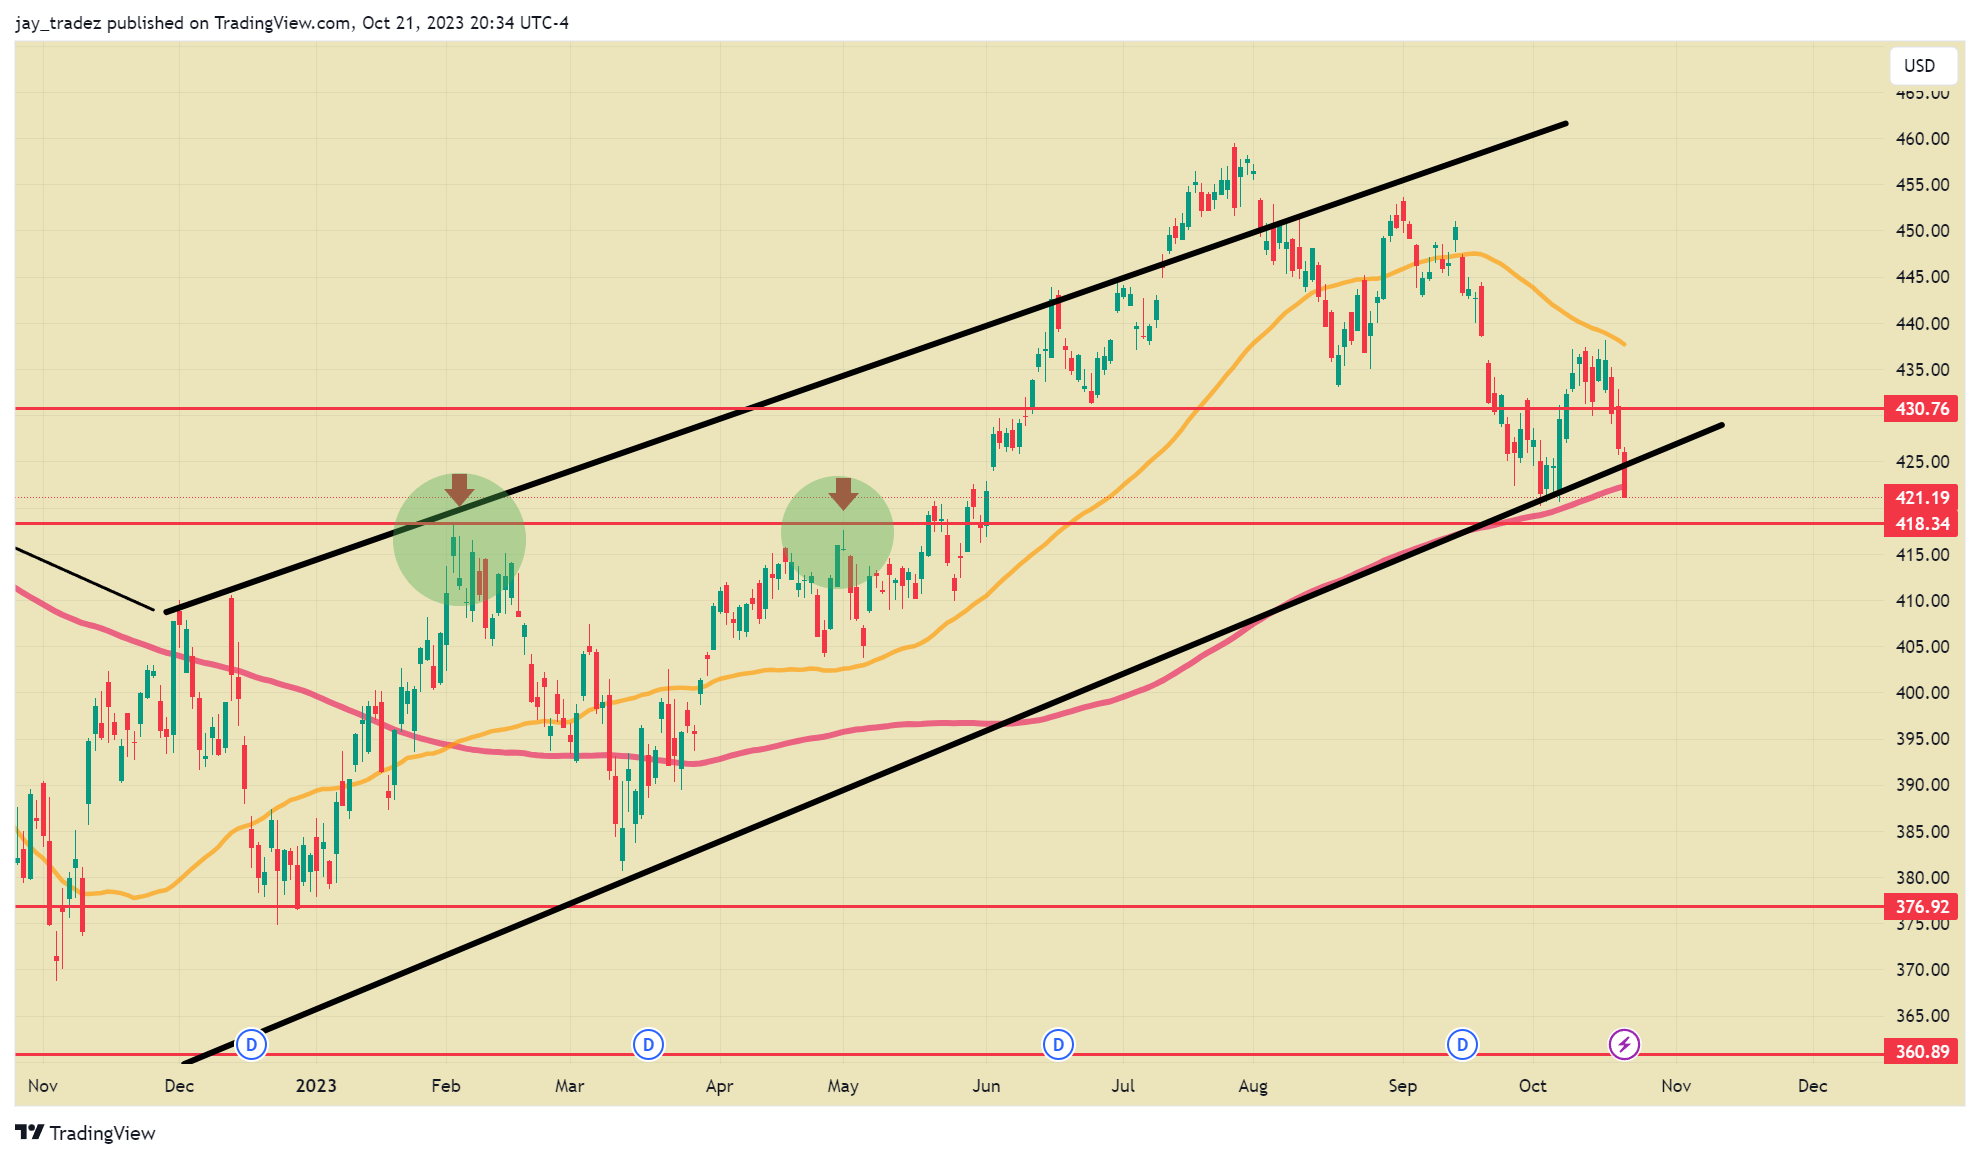
As of last Friday, 545 stocks have made new 52-week lows, while only 13 Nasdaq stocks are making new 52-week highs. Big tech names have been the year’s bright spot, driving much of the rally in the S&P and Nasdaq. But the index has now seen 35 days of new lows as the risk of potential resurging inflation, U.S. risk of joining the war, and continued low demand for new treasury issuance. This dynamic is clear when looking at the S&P500 price chart, as breadth indicates that the majority of stocks are moving lower. On Friday, the SPY closed below the 200-MA and under its bull trendline since the bottom in December 2022, showing bears are in control.
On the news side, Biden visited Israel during the Hamas-Israel war, setting a major precedent for a sitting US President to personally visit ground zero of a war zone. This sends a strong message that this time might be different. Furthermore, with US citizens both killed and taken hostage by Hamas, the US would undoubtedly have to get involved this time. If Iran joins in on the conflict or the US sends soldiers to Israel, this would be an outright sell signal for the equity market. As horrible as the situation is in these cases, it would be a deciding factor on how Bitcoin will be categorized based on its reaction to a risk-off event in the equity market. This would set the tone and trend for Bitcoin in the next few months, based on whether prices hold and display qualities of a safe-haven asset.
Macro Analysis
Anchor Pricing is stirring the market again!
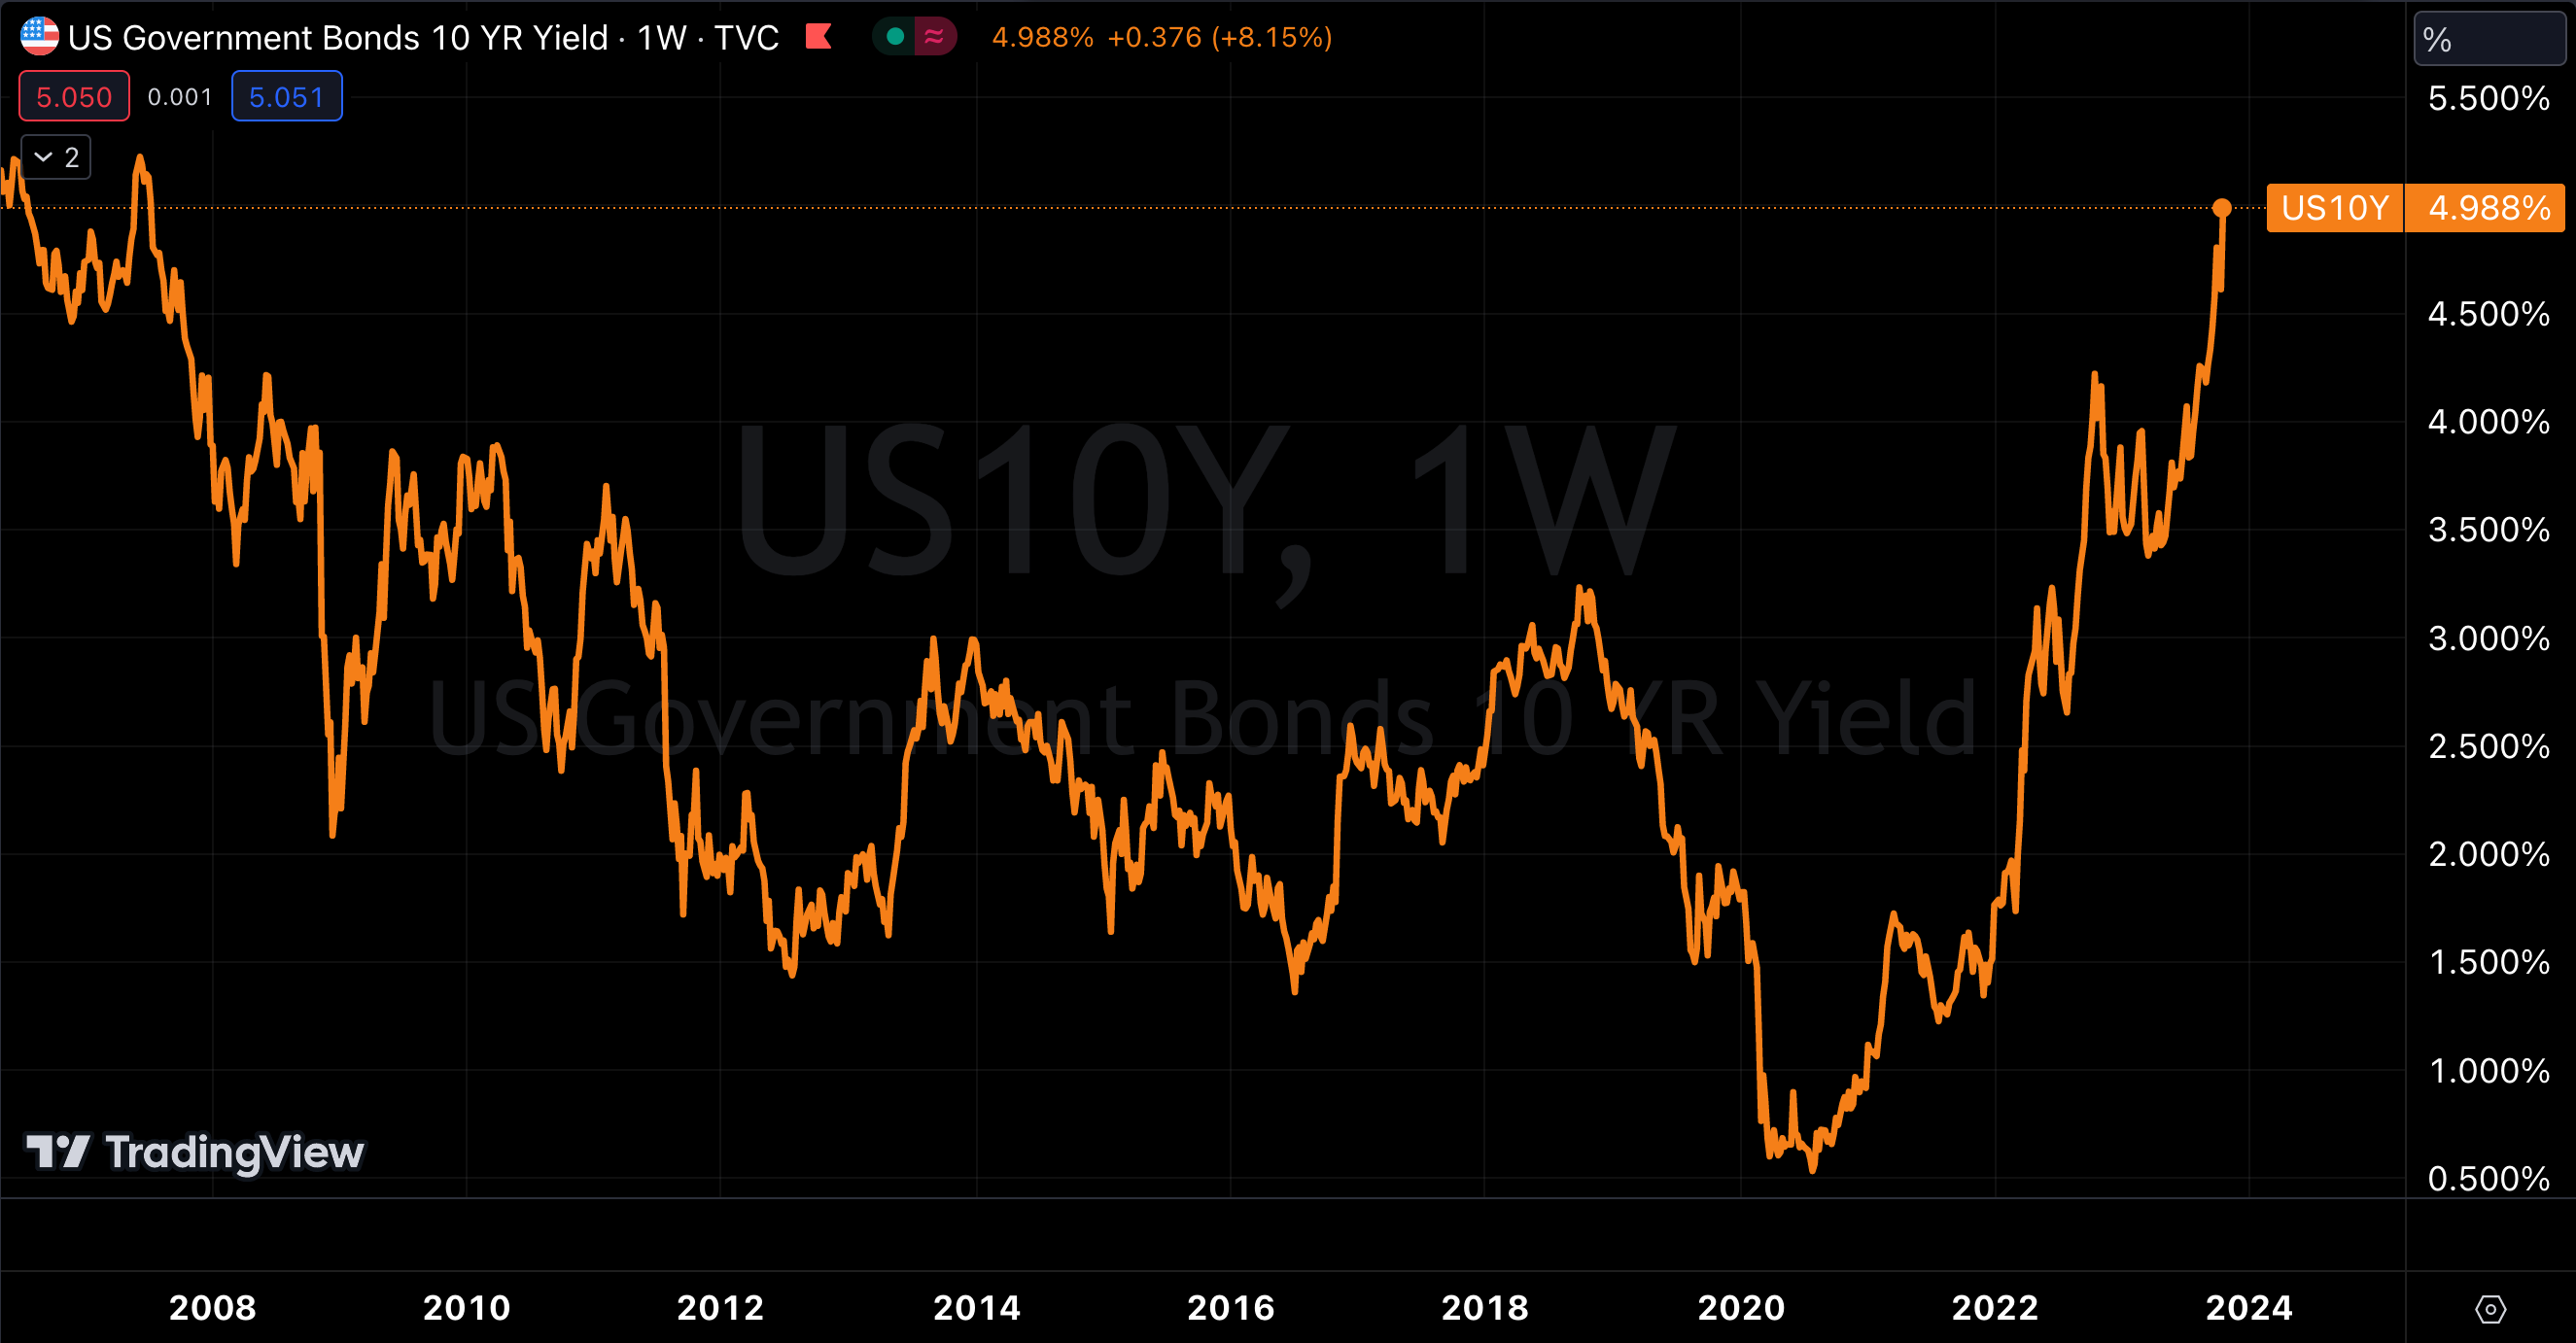
U.S. Treasury yields have risen to the highest level in 16 years, with the 10-year rate at 4.99% as of this writing, since 2007. The recent spate of stronger-than-expected data has weakened the impact of comments made by several Fed officials, leading to a surge in US bond rates across all maturities. We believe that the better the economic data, the more the market will tighten financial conditions further, thereby increasing the certainty of a hard landing in the recession. From a macro perspective, the market may have one more fall, but we can look forward to a rate cut after the hard landing.
Crowded Trades
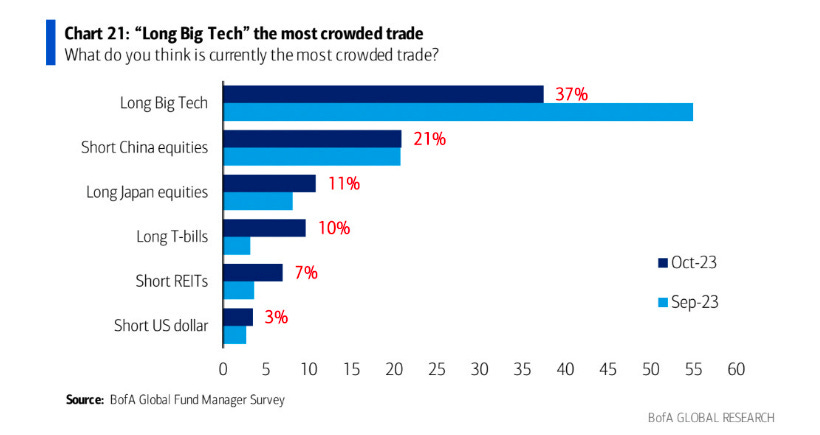
According to the latest Bank of America Fund Manager Survey, Big Tech is still the most crowded trade. This has repercussions for the crypto market, not necessarily good ones. The most overcrowded trades are usually the most overvalued, and when a correction comes, it will be the one that sees the sharpest correction.
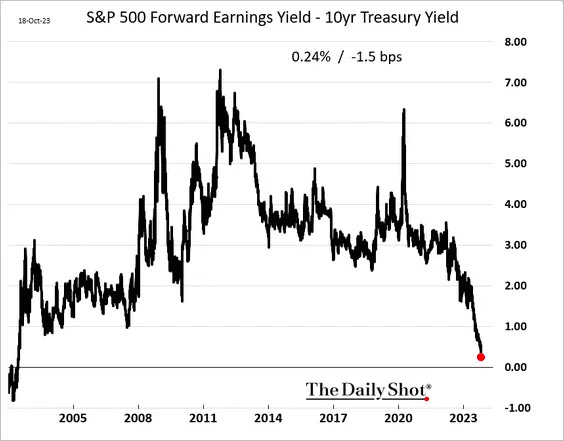
Furthermore, the S&P 500 equity risk premium, which is calculated as the earnings yield (or the reciprocal of the price/earnings ratio) minus the 10-year treasury yield, is now close to zero. This marks the first time equities yield nearly the same returns as bonds in over two decades. This situation is quite unusual because equities are inherently riskier than bonds, and one would typically expect them to offer significantly higher returns.
This has significant implications for the cryptocurrency market, particularly Bitcoin. Currently, Bitcoin is showing positive signs, with an increasing likelihood of a Bitcoin ETF approval, as suggested by Bloomberg analysts (90% probability). Additionally, there is a growing perception of Bitcoin as a safe haven asset. However, a sharp correction in the stock market could reverse recent gains because investors tend to exit risky assets simultaneously.
If our prediction holds true, and the majority of the sell-off originates from the technology sector, it would likely impact Bitcoin and other cryptocurrencies more broadly. This is because tech investors often have exposure to cryptocurrencies. During risk-off periods, assets across the board tend to suffer. Nevertheless, it’s worth noting that Bitcoin currently exhibits a low correlation with the equity market, although this may change during times of heightened market volatility compared to periods of relative stability.
CPI data came out again brightly
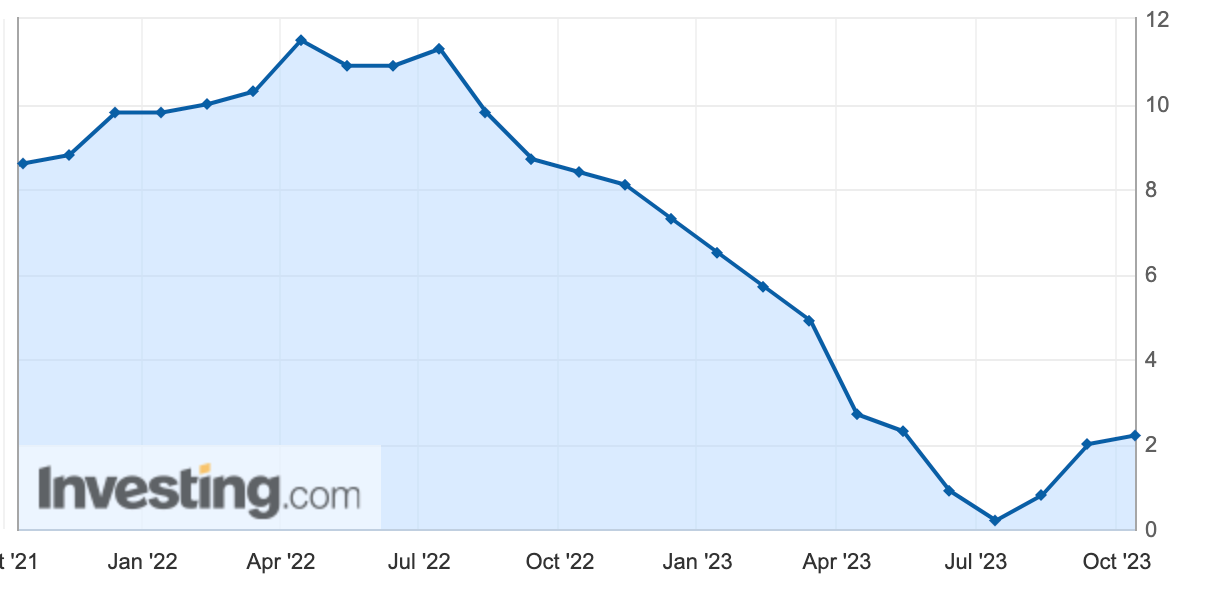
The U.S. Consumer Price Index (CPI) rose rapidly for the second consecutive month in September, registering 3.7%, higher than the expected 3.6%; the core CPI registered 4.1%, continuing the downward trend. Overall, The CPI still supports the Fed in maintaining high-interest rates.

In terms of major components, food prices rose 3.7% year-on-year; energy prices fell 0.5% year-on-year; and core goods and services prices rose 4.1% year-on-year, with the weight of more than one-third of the overall CPI, and housing prices rose 7.2% year-on-year. The core inflation data leaves room for the Fed to pause on interest rate hikes, and the US employment data will now become an indicator of what to watch for.
Hot Upstream Data Raises Questions
U.S. September PPI hotter than expected: On October 11, the U.S. Department of Labor showed that the U.S. Producer Price Index (PPI) grew at an annualized rate of 2.2% in September, which greatly exceeded expectations of 1.6% and was the third consecutive month of above-expectation gains. This was a sharp rebound from August’s 1.6% and the largest annual increase since April 2023. In addition, the monthly increase in the Producer Price Index (PPI) came in at 0.5%, beating expectations of 0.3%. Excluding the more volatile items of food and energy, the core Producer Price Index (core PPI) increased at an annualized rate of 2.7% in September, which exceeded market expectations for a 2.3% increase and was up from 2.2% in August. Meanwhile, the monthly rate increase in the core PPI came in at 0.3%, beating expectations for a 0.2% increase.
The upstream and downstream transmission mechanism can’t help but make people think that the CPI data in the next few months will be able to take over the PPI so that the Fed’s fight against inflation, “the last mile,” appears to be extraordinarily long. According to historical experience, when inflation continues for a longer period, the challenge of fighting inflation will become more difficult. If there is a repeat of the severe inflation of the 1970s, triggered by the sharp increase in oil prices, it may push inflation to stay at a higher level for a longer period. In such a scenario, the Fed may need to take further action by raising interest rates to fight inflation.
Fundamental Analysis
Sentiment Returns to Optimism
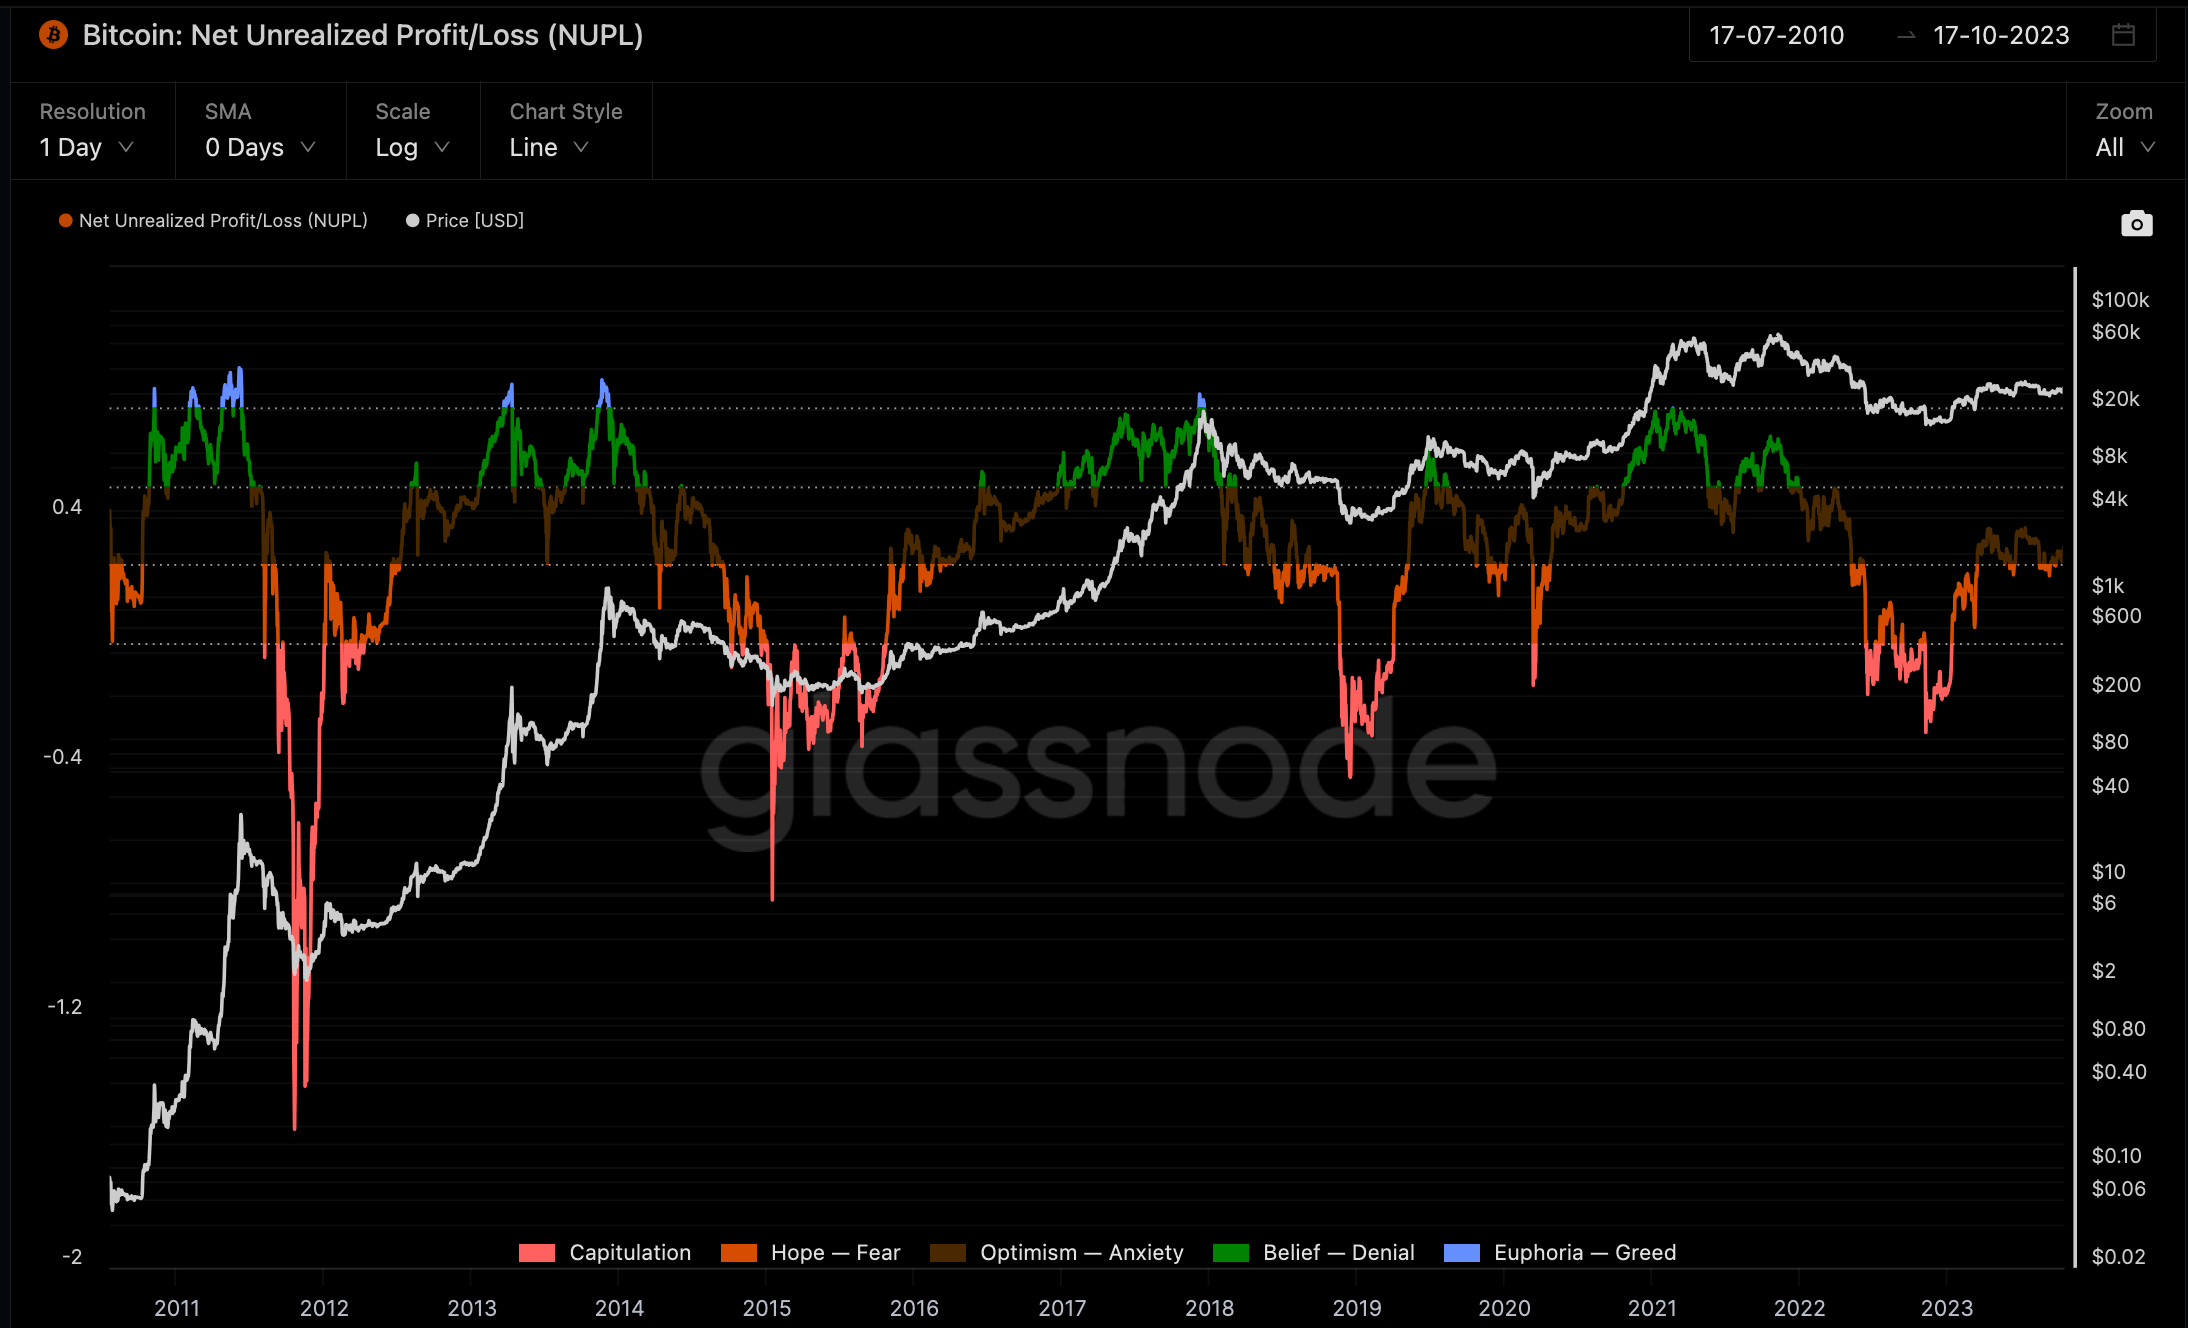
Net Unrealized Profit/Loss (NUPL), a chained indicator used to calculate the difference between relative unrealized profit and relative unrealized loss, is currently shifting between the fear and optimism areas.
The NUPL consists of five horizontal zones, ranging from the red capitulation zone to the blue zones of euphoria and greed. The Bitcoin NUPL index recently bottomed out of the “capitulation zone” as the price rose and is now at 0.29, in the brownish-yellow optimistic zone, indicating that optimism is back in control.
AHR999 Hoarding Currency Indicator (Nine Gods Index)
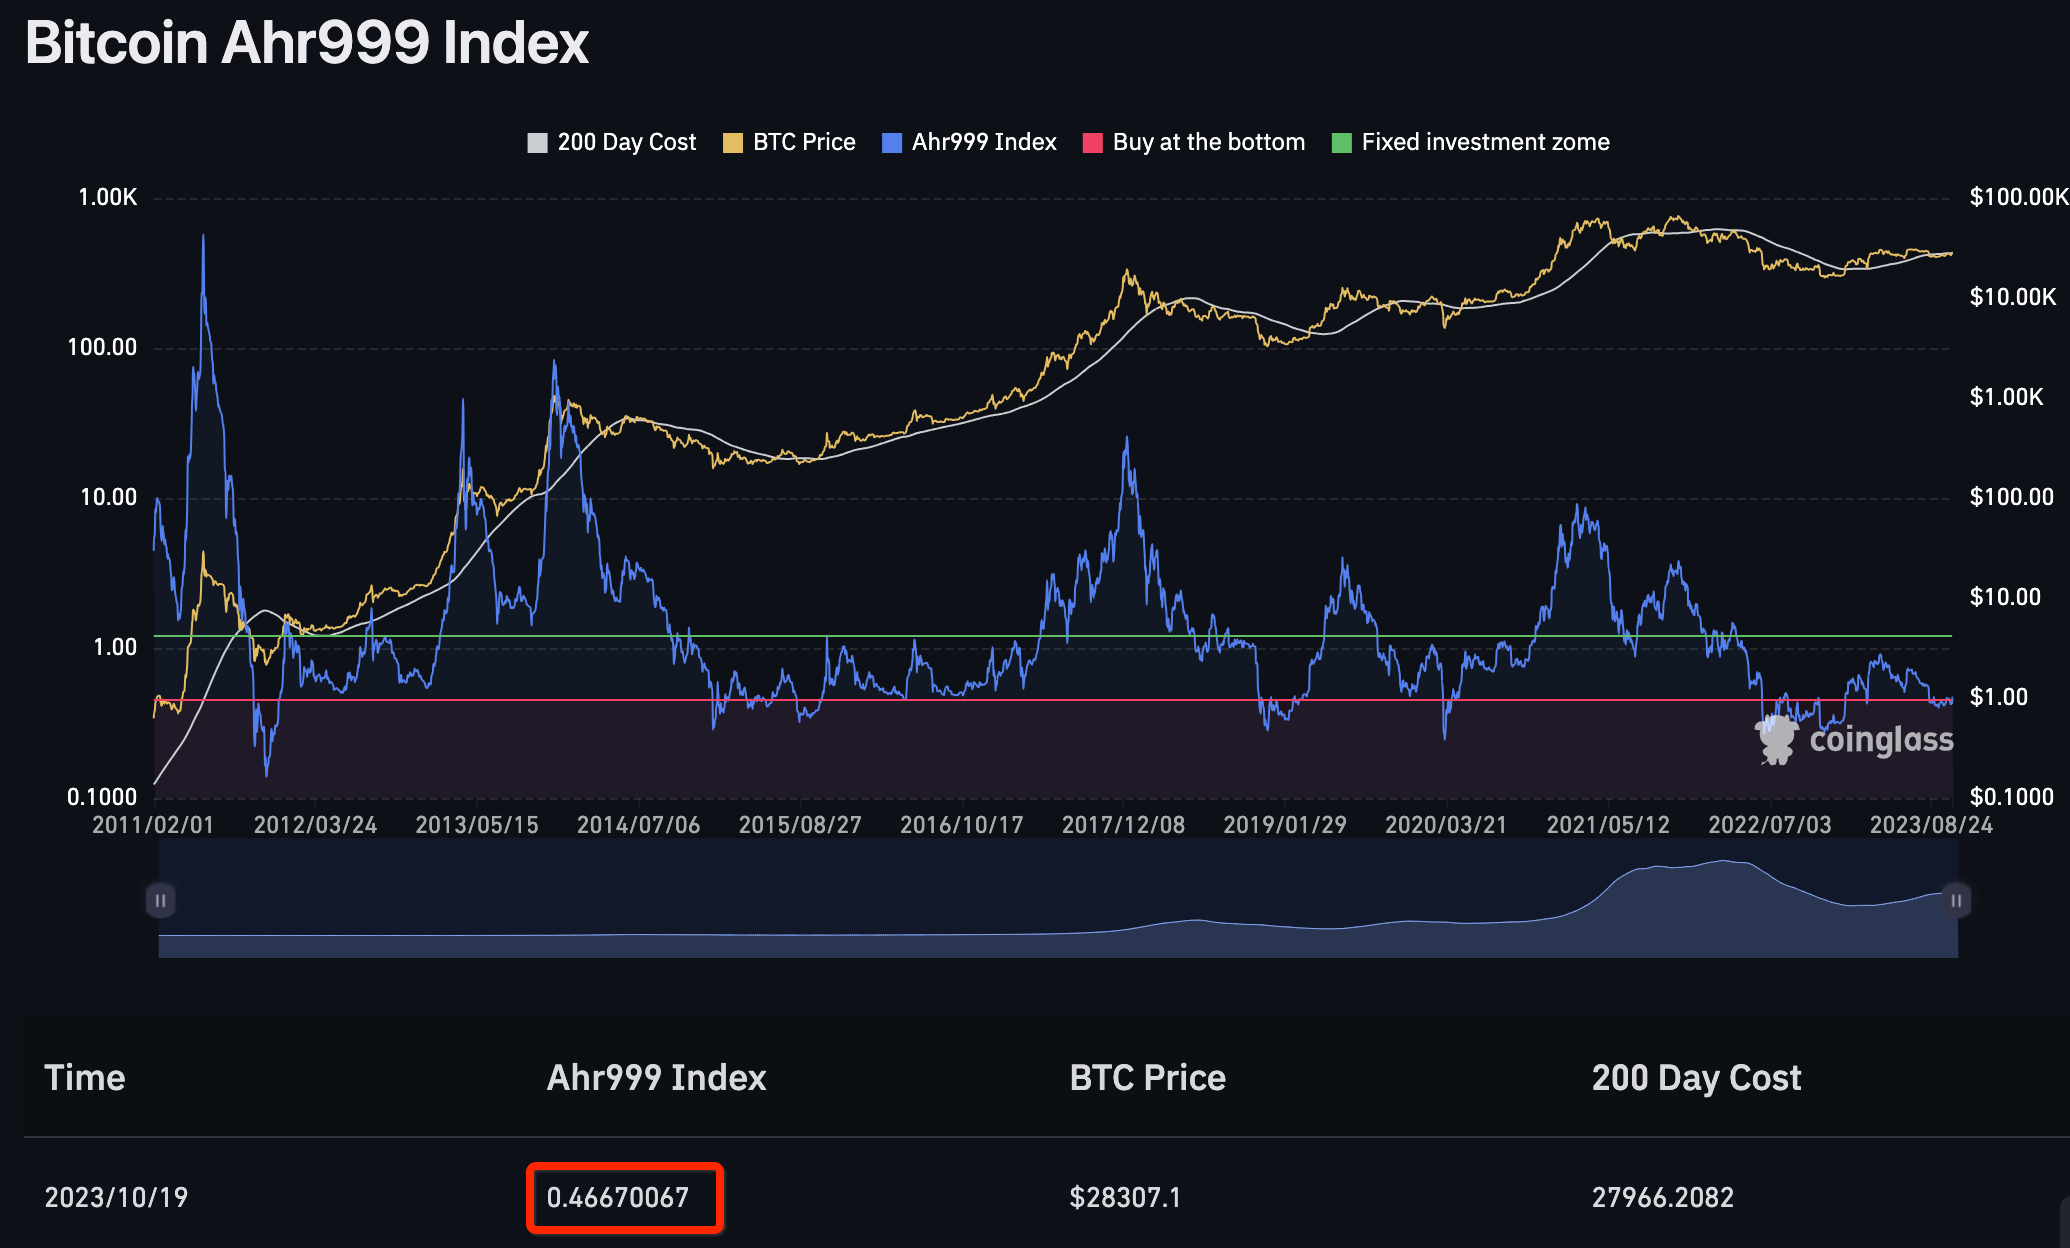
The famous AHR999 Index can assist Bitcoin fixing users in making investment decisions in conjunction with opportunistic strategies. This index implies the yield of short-term Bitcoin fixing and the deviation of the Bitcoin price from the expected valuation.
When the index is < 0.45, you can take a bottoming position; when the index is between 0.45 – 1.2, it is suitable for investment. The AHR999 index is 0.467, just slightly above the bottoming threshold of 0.45, implying that it is a suitable time for investment.
Trading Recommendations
Bitcoin
Futures | Spot
No high-probability swing trades. I would not chase Bitcoin long, especially from a swing perspective.
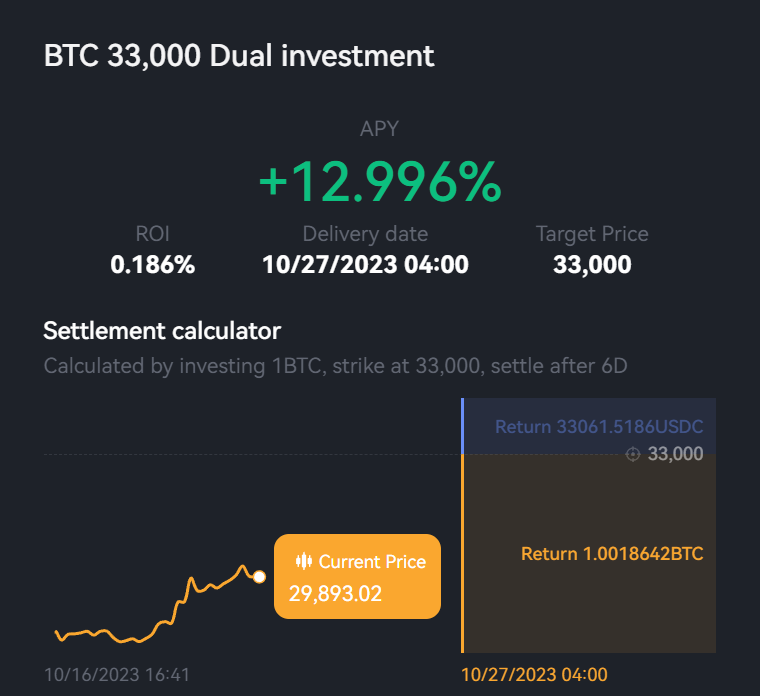
Structured Product
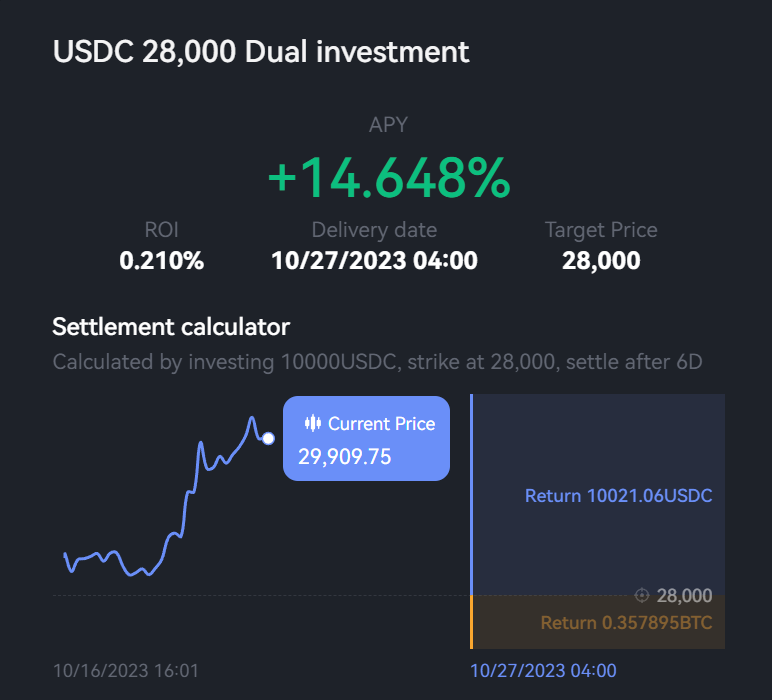
For those currently with USDT, we suggest $28,000 Buy-The-Dip with a 4 – 7 day duration. $28,000 is the do-or-die level that Bitcoin has to hold, and we believe this would be the first strong support, as shown through the multiple tests this week.
For those currently holding Bitcoin, we suggest a $33,000 Covered Gain option with a 4 – 7 day duration. Despite our bullish outlook, we believe that $32,000 will be a strong resistance, and we would give it a 10% probability that Bitcoin could break over within the next week. Therefore, it would be wise to generate additional Bitcoin yields while patiently awaiting price increases. We chose $33,000 just in case we have spikes above $32,000, giving it a $1000 buffer.