- Bitcoin pulled back with $70M long liquidations and OI decreasing by approximately 4% across exchanges.
- Elizabeth Warren proposed a plan to crack down on Crypto.
- Bitcoin undergoes sharp correction after breaching $44k and achieving 8 consecutive positive weekly returns for the first time since mid-2017.
- Google search trends show that there is still a lackluster retail exuberance in the crypto market.
- Strong Altcoins continue to show strength even while Bitcoin is pulling back.
Contents
Thoughts
The market pulled back as we had expected. There was a lot of froth in the markets as sentiment turned ultra-bullish in such a short period. It seemed like people forgot that just a month ago, most were screaming crypto was dead. However, we believe this pull-back will provide the opportunity those on the sidelines are waiting for, and dips should be bought strategically. If you are scared and don’t trade your plan, then you’ll miss out again. You cannot want a dip to build a position but when the dip comes, be scared and don’t enter. It’s hypocritical, but it’s just a part of human nature.
Technical
Bitcoin
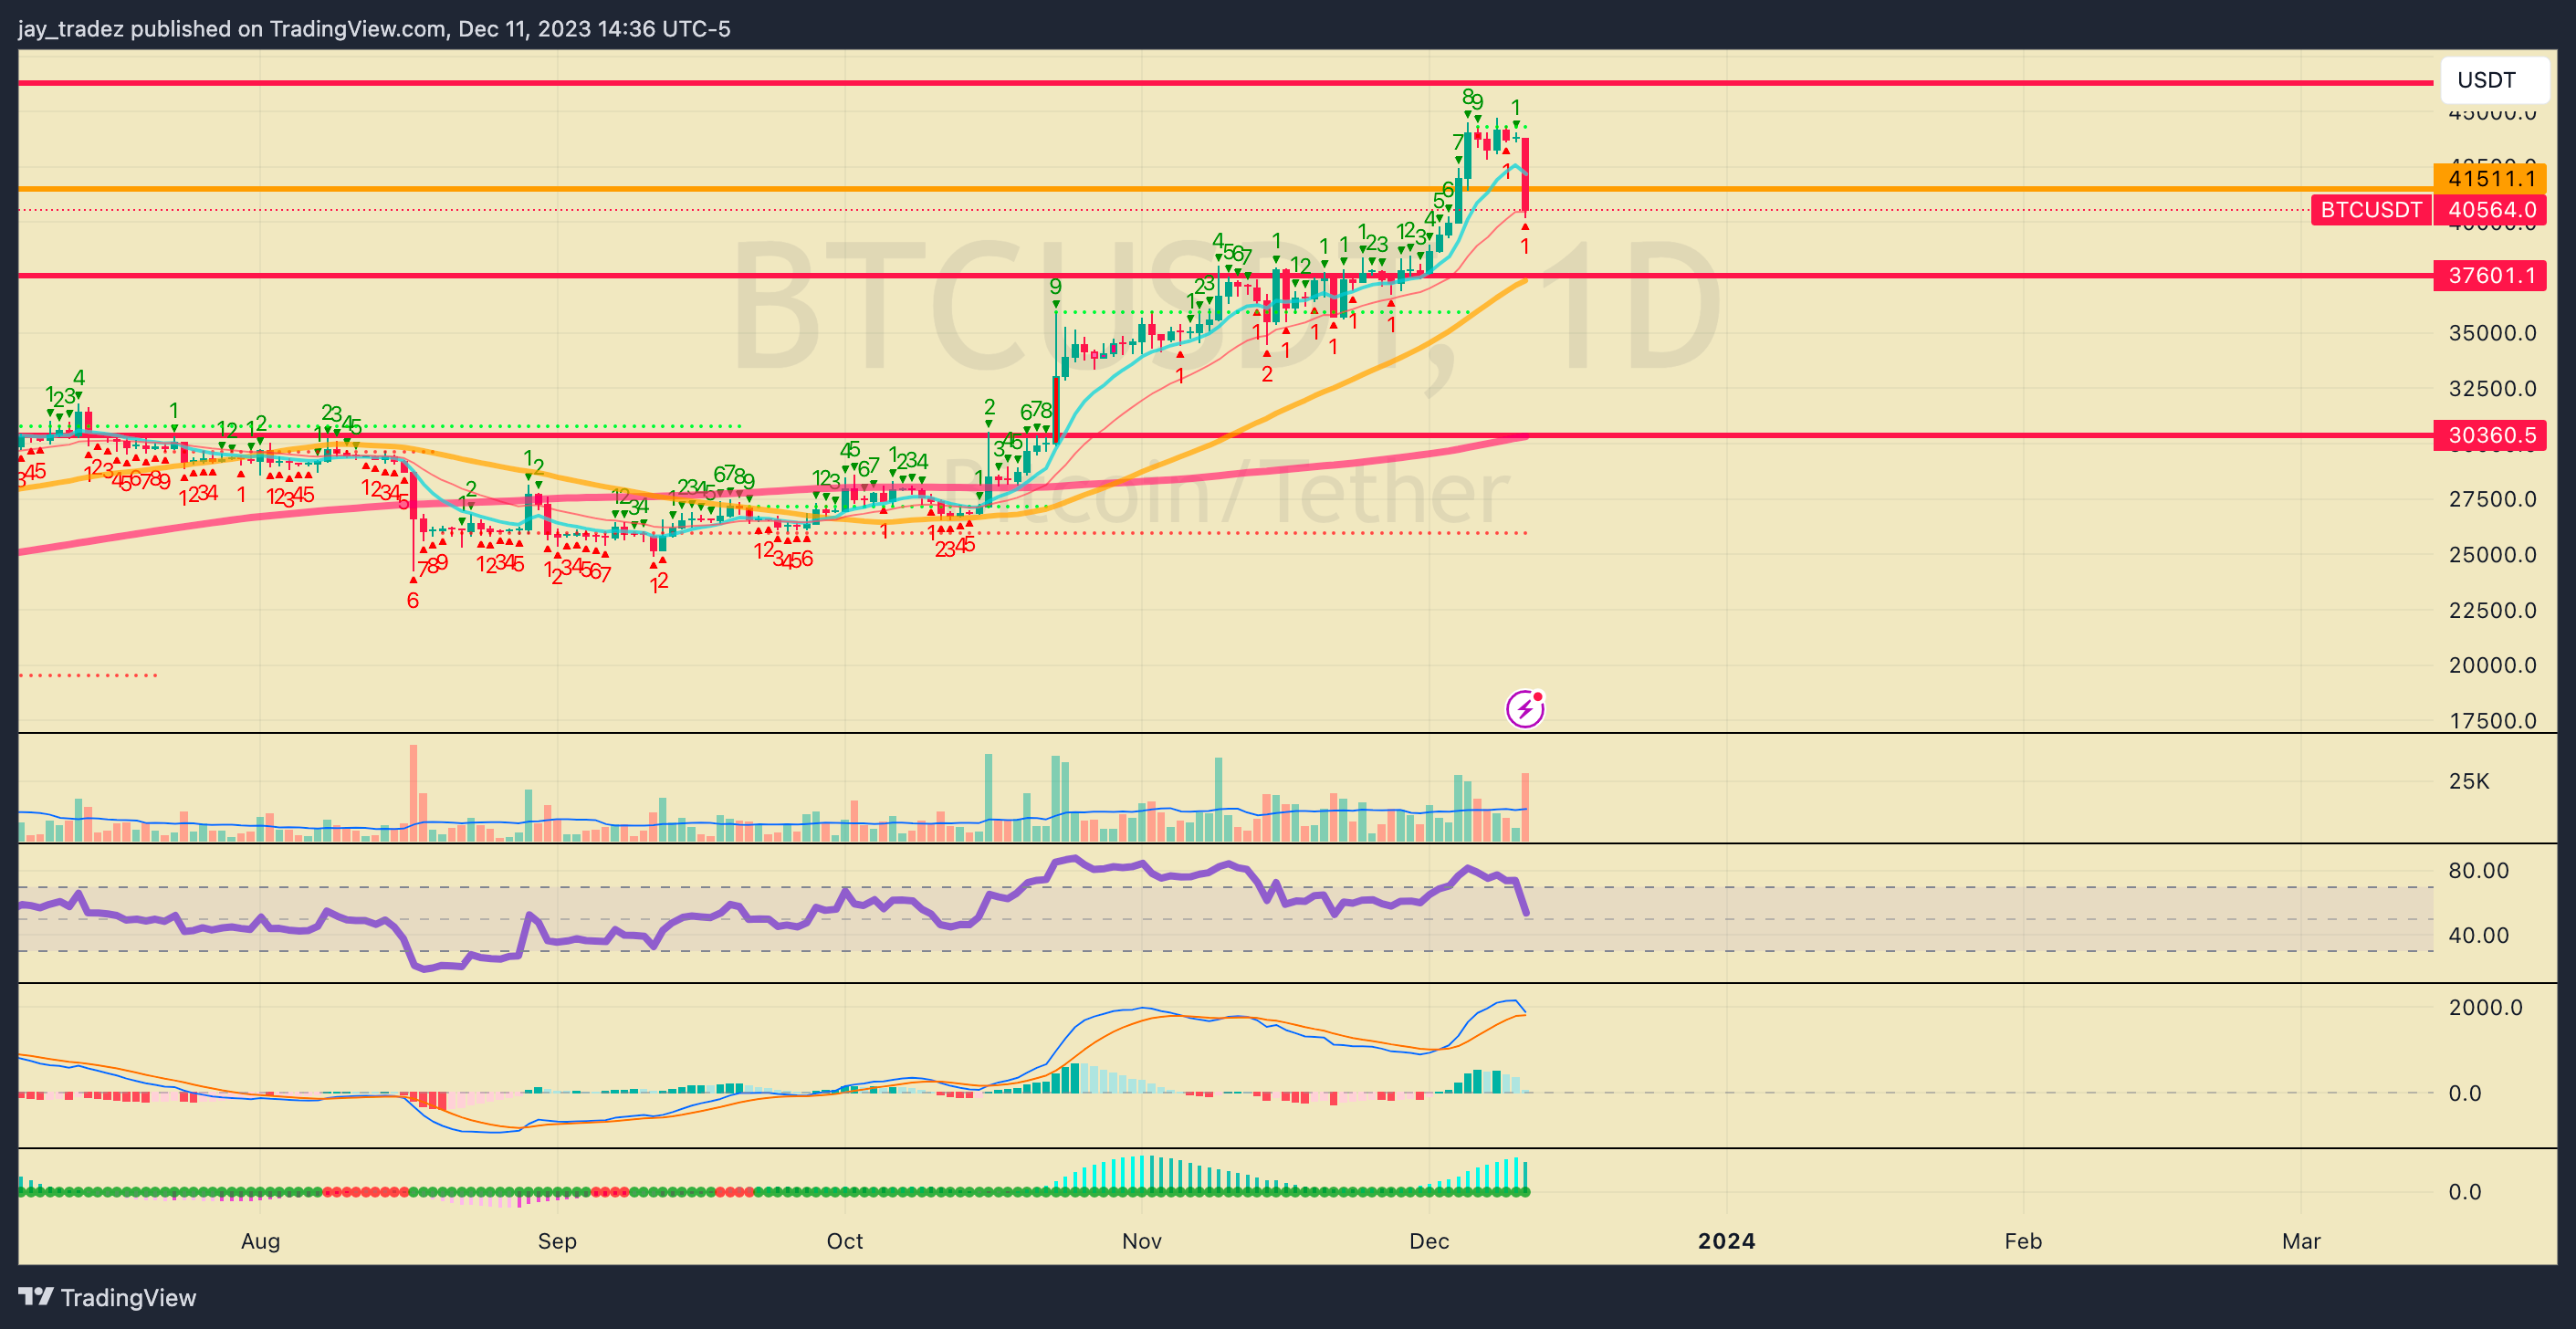
Last week, we warned that a pullback might be coming after seeing a 9 on the DeMarks indicator, which often marks the top or bottom of a move. The probability of a pullback was high, especially after eight consecutive weeks of green closes; the odds were in favor of the bears. It seems that as Bitcoin consolidated around the $43,500 level, people built up leveraged longs in expectation of a continuation to the upside.

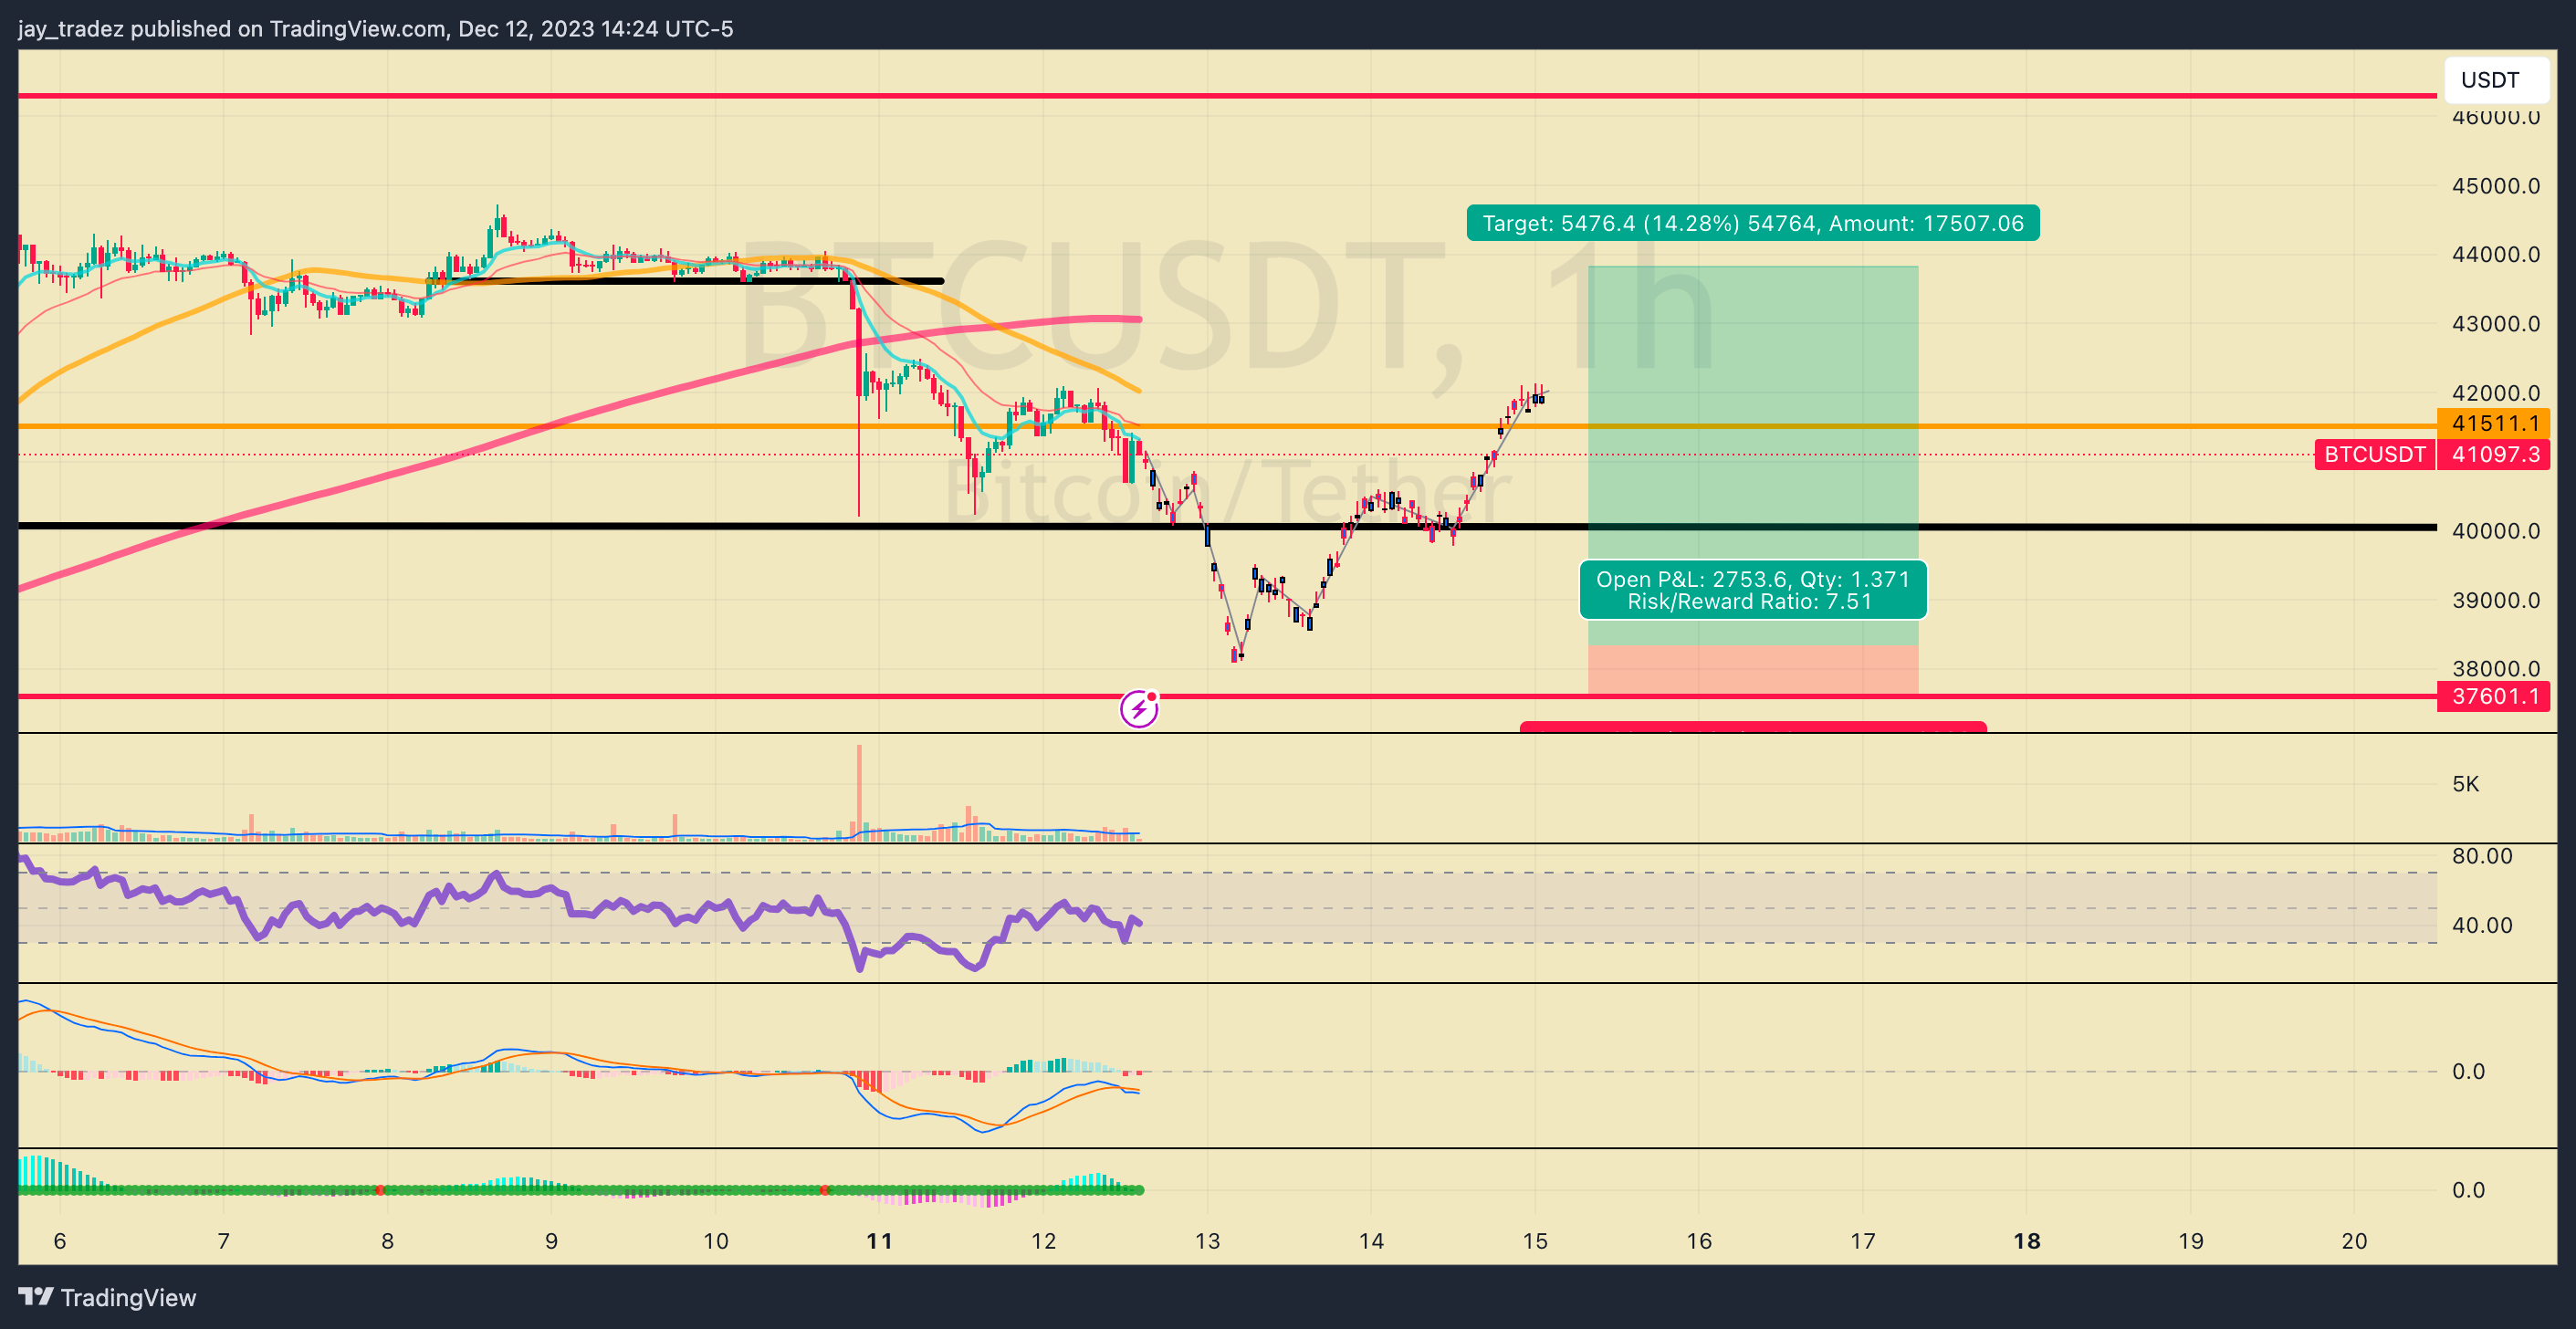
However, below we can see that they were liquidated as prices plunged instead through their buy zone. The yellow block represents a build-up of capital that will be liquidated if prices reach that level.
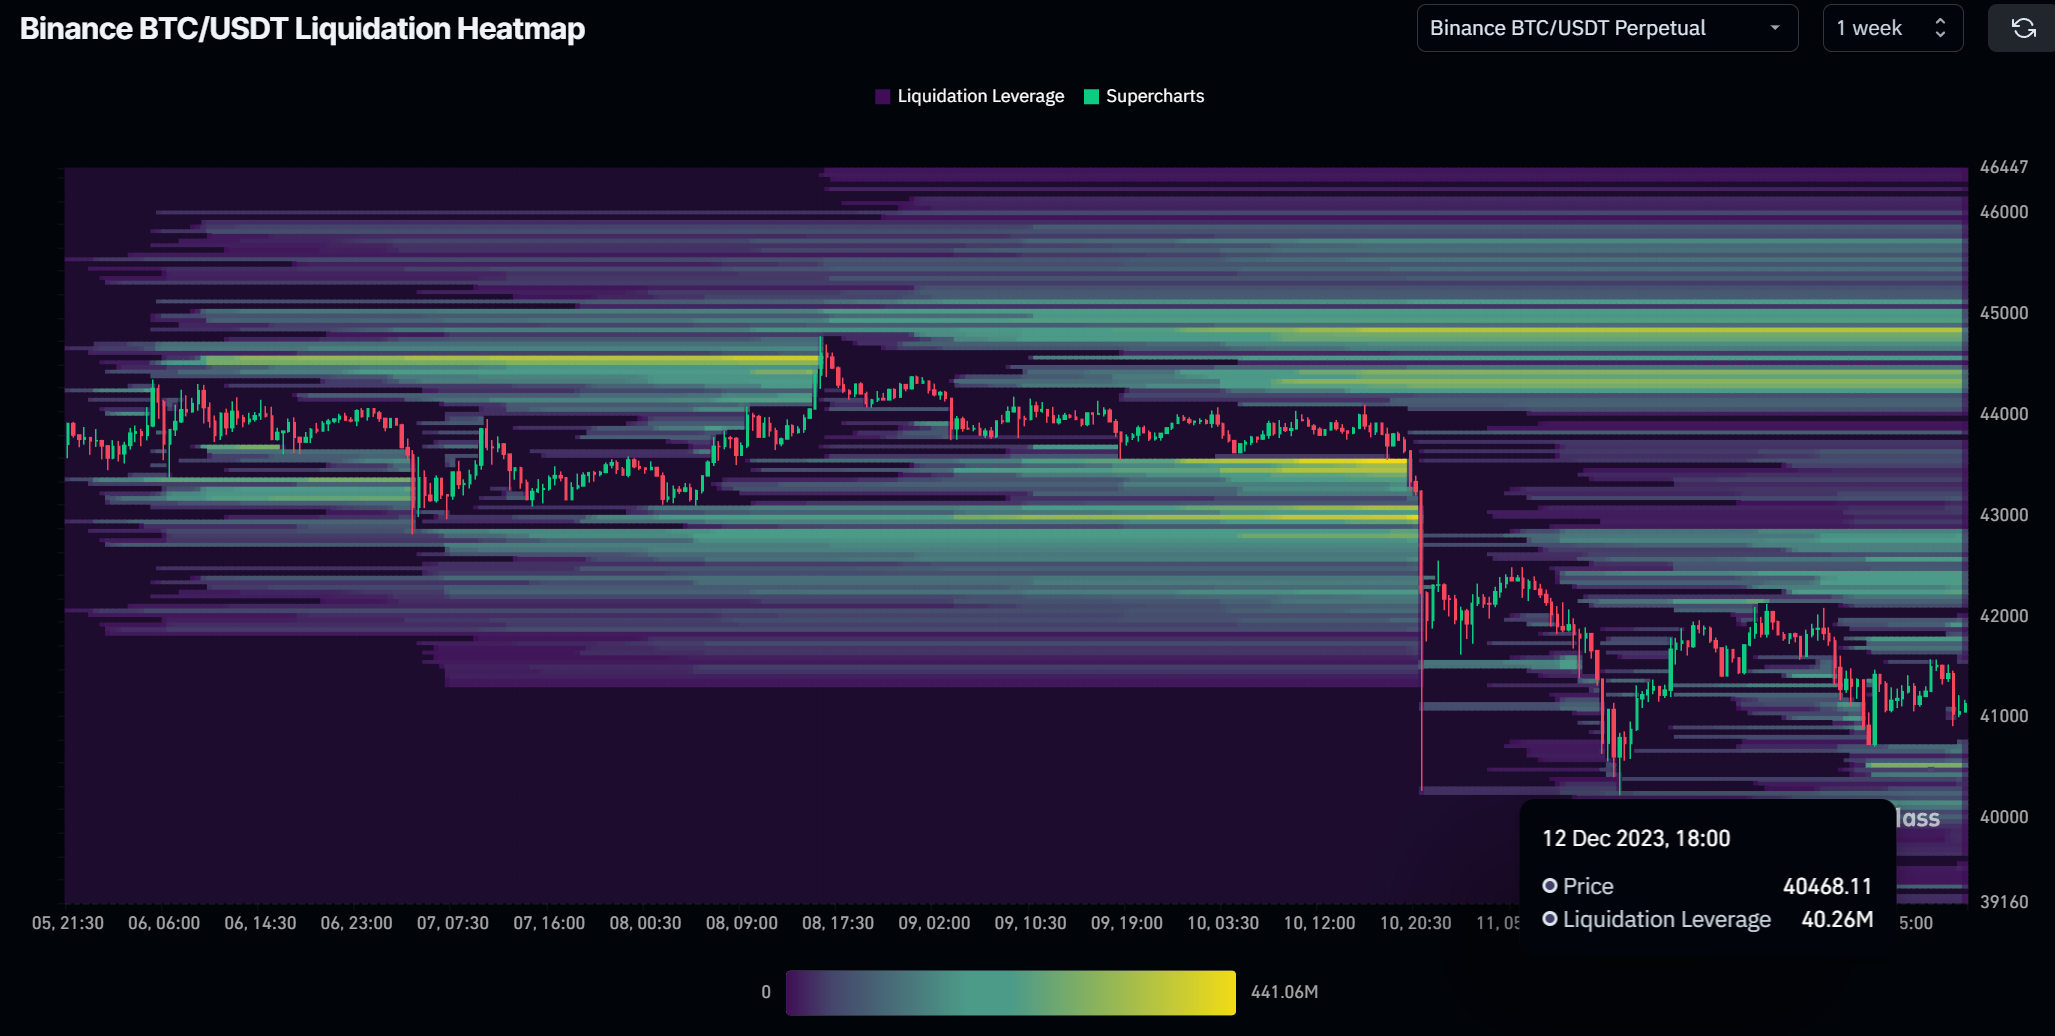
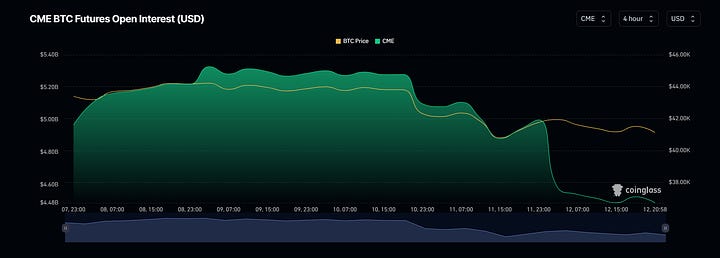
Last week, we stated that we wanted to see open interest down, funding rates down, premiums flattened on the CME, and long liquidations up. So far, we have observed funding rates come down, long liquidations rise, and open interest decrease. However, liquidations were not outsized, and there is still a lot of leverage open. Additionally, we would like to see the funding rate come down a bit more. As we were writing this, we continued to see open interest decrease, especially on the CME futures. This is a good sign, and if the open interest flattens out to pre-$38,000 breakout levels, we could be near a reversal point. However, above on the liquidation chart from Coinglass, we do not see too much leverage built up nearby so if we can get a quick liquidation under $40,000, that will be the opportunity to build a position.
Last week, we mentioned that we would like to see a pullback to $38,000, which is the first major level of support, and we continue to hold this viewpoint. The $38,000 – $39,000 range would be the area we would enter to see if this sell-off will reverse.

Ethereum
ETH experienced a pullback to its breakout level at $2,150, marking a solid entry spot. When a level of resistance is broken, it turns into support because buyers who missed out will be bidding there. So, when it is retested on a pullback, it offers a good entry point. What we anticipate might happen is a break under $2,150, reaching around the $2,050 – $2,080 area, and then reversing higher, reclaiming $2,150. This type of failed breakdown offers optimal risk and reward for trading and should be taken advantage of. This also aligns with our view of Bitcoin experiencing another small wave of liquidation, bringing prices under $40,000 before reversing.

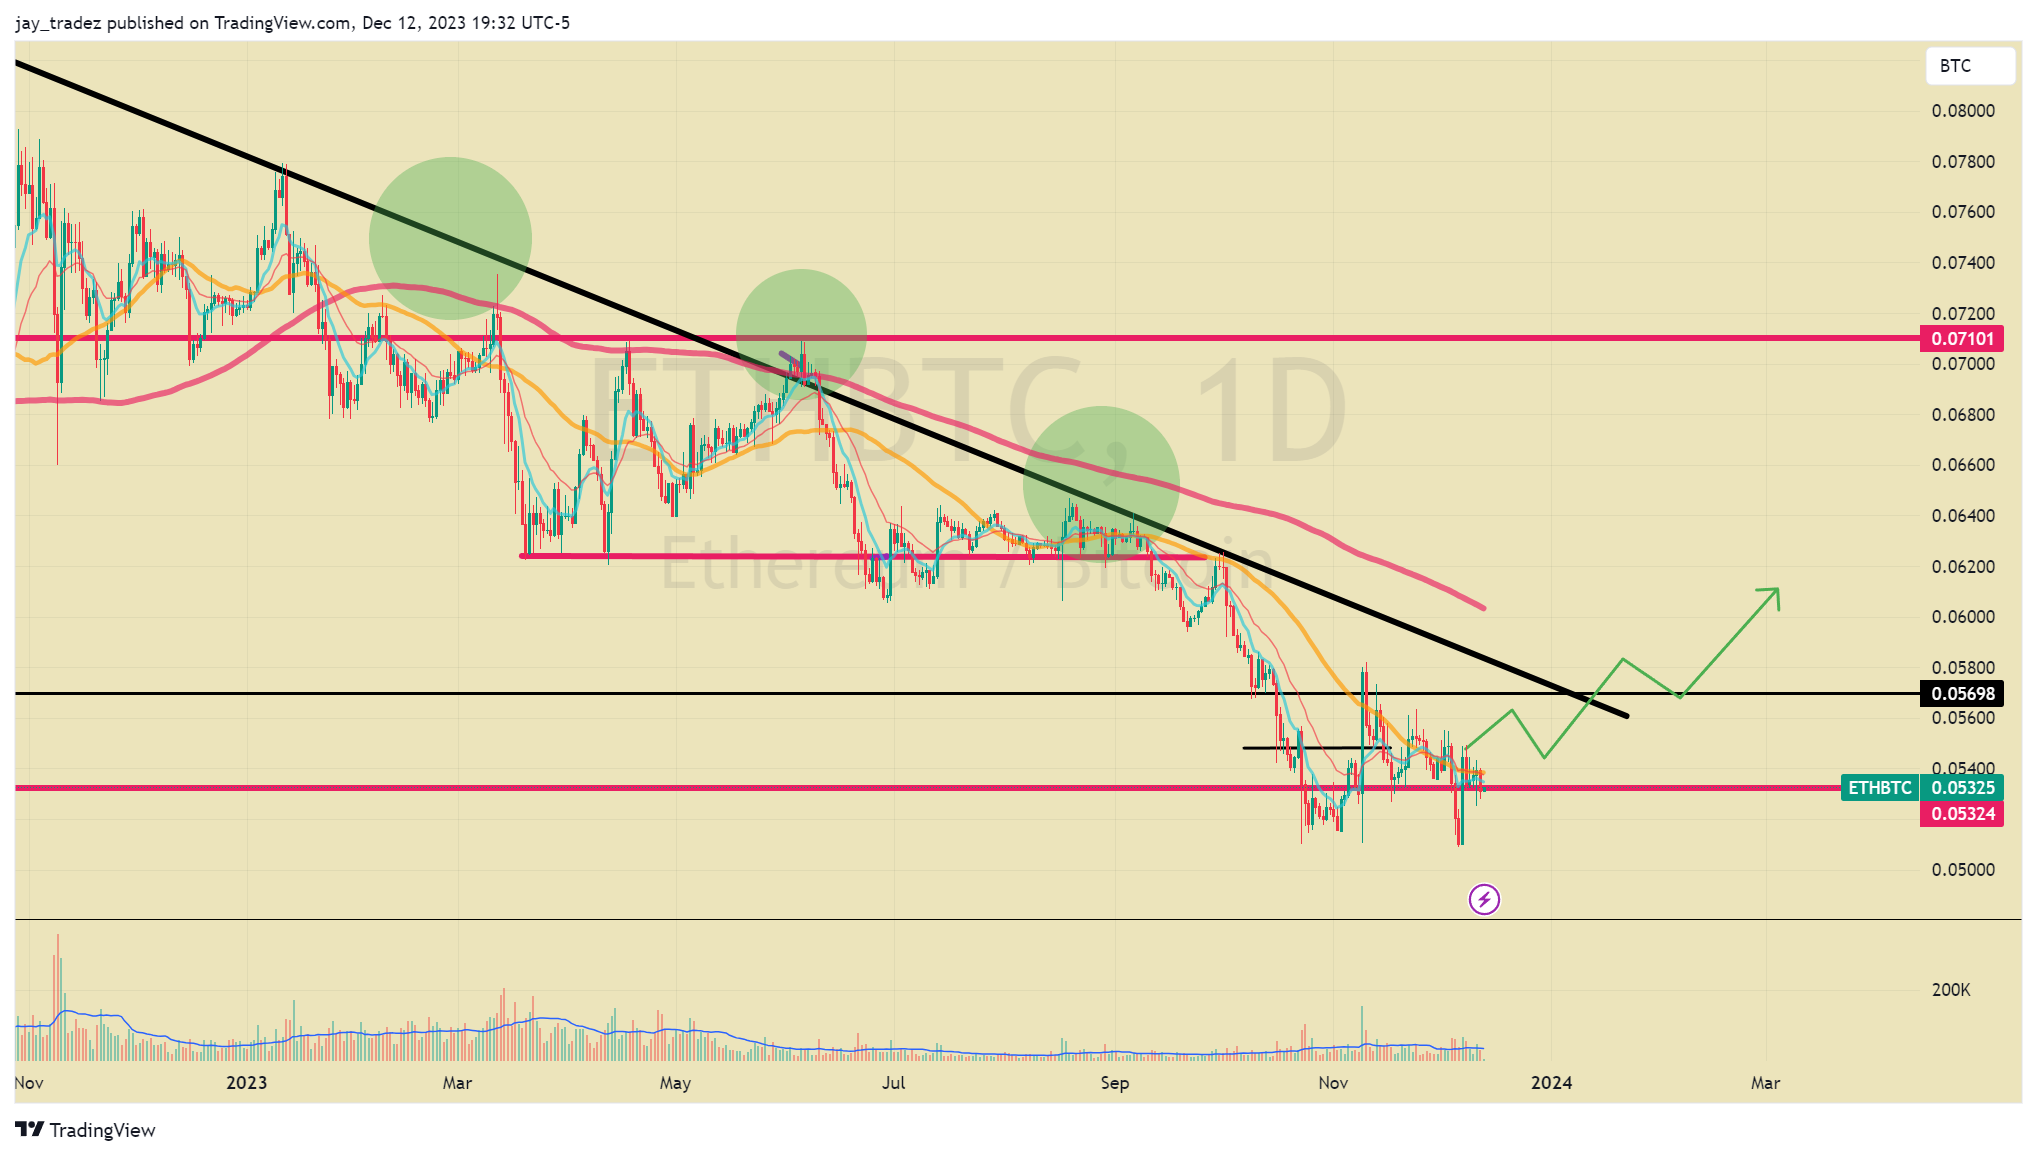
Looking at the ETH/BTC pair, there has been a bit of retracement, and we still have not broken the year-long downtrend. However, this double bottom here could be very constructive if, after this pullback, ETH gets the capital flow from Bitcoin, as we talked about last week. On the chart, we drew the pattern that might play out and outlined what we want to see for ETH outperformance.
Altcoins
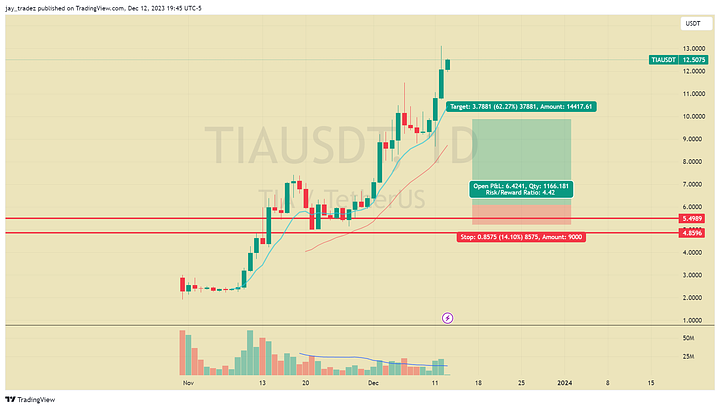
Total3 followed through with the breakout, surpassing its high from August 2022, indicating that Altcoins are officially back. Even with the Bitcoin pullback, they are holding up with resilience. Some of the stronger Altcoins are performing exceptionally well and making new highs even as Bitcoin is pulling back. This is the type of action we want to see if we want this Alt season to continue. Some of the strong coins include $AVAX, $INJ, and $BIGTIME. We called out $INJ and $AVAX in the Discord, so if you are into short-term trading, be sure to join us there.

Trading Recommendations
Bitcoin
Futures | Spot
Glad we talked about taking profits here last week as we got the dreaded quick 10% pullback this week. However, this gives us opportunities to reload and enter a position if you have been waiting on the sidelines. $38,000 – $39,000 is a reasonable spot to enter a long position especially if we get another sell-off / wick under $40,000 and a reclaim above. So entry around $38,000 – $39,000 stop loss under $37,500 and target $45,000 this year’s high. The risk to reward comes out to be around 6 – 7 making this a solid trade.
Structured Product
Last week, we stopped suggesting Buy-the-dip because of the increased risk of a pullback which was the correct decision. Instead, we suggested covered calls to earn interest for those holding Bitcoin. The trade played out perfectly and expired out of the money, meaning we received full profits.
This week as Bitcoin got a sell-off wiping out OI and a wave of small liquidation volatility has been driven up and so have yields. So now it is again a good opportunity to invest in Buy-the-dip to lock in these high yields. What we have been trading on the desk here at Pionex is a 3-10 day duration $38,500 – $39,000 strike Buy-The-Dip products. These are returning 25% – 30% depending on the strike level chosen.

News of the Week
Bitcoin Inscription Has Been Added to the US National Vulnerability Database
The U.S. National Vulnerability Database (NVD) flagged Bitcoin Inscription as a cybersecurity risk on December 9, calling attention to security vulnerabilities developed in Ordinals Protocol in 2022.
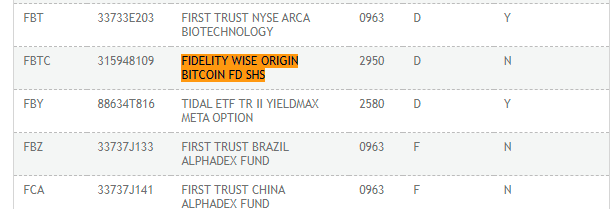
Fidelity Spot Bitcoin ETF Added to DTCC Active ETF and Pre-release List
On December 8, the Fidelity Spot Bitcoin ETF “FIDELITY WISE ORIGIN BITCOIN FD SHS” was included in the active ETF and pre-release list of the Securities Depository and Clearing Corporation (DTCC), with the trading code FBTC.
US Senator Elizabeth Warren Proposes Bill to ‘Crackdown’ on Bitcoin and Cryptocurrencies
U.S. Senator Elizabeth Warren introduced a bill calling for stricter regulatory measures on cryptocurrencies to make them “more compliant.” Warren emphasized that “digital currencies are used as a basis for criminal activities such as money laundering, drug trafficking, and sanctions evasion.” Risk”, arguing that it must be addressed through a strict regulatory framework. After the incident, the price of Bitcoin quickly plummeted to the support of $40,000.
Summary of U.S. November CPI report:
- U.S. CPI rose 0.1% month-on-month, higher than the expected 0.0%.
- The total CPI increased by 3.1% year-on-year, slowing down from 3.2% in October.
- The annual CPI rate fell back to its lowest level since June.
- U.S. core CPI rose 0.3% month-on-month, in line with expectations.
- Core CPI rose 4.0% year-on-year, the same as in October.
- Strong core CPI data may not support market expectations for rate cuts.
Fundamental analysis
Gains Still Expected
In this issue, we focus on the MVRV ratio, which is equal to the circulating market capitalization (Market Cap, MV) divided by the realized market capitalization (Realized Cap, RV). The expression is MVRV = MV / RV.
The MVRV ratio indirectly reflects the imbalance between Bitcoin supply and demand in the secondary market, which, in turn, can indicate the degree to which the market price is undervalued or overvalued. For example, an index of 1.2 means that the market price is 1.2 times the actual price (20% profit), an index of 1 means that the market price is equal to the actual price (breakeven), and an index of 0.8 means that the market price is 0.8 times the actual price (20% loss). A high MVRV value (>2.4) indicates that the market is holding a large amount of unrealized profits, while a low MVRV value (<1.0) indicates unrealized losses in the market.
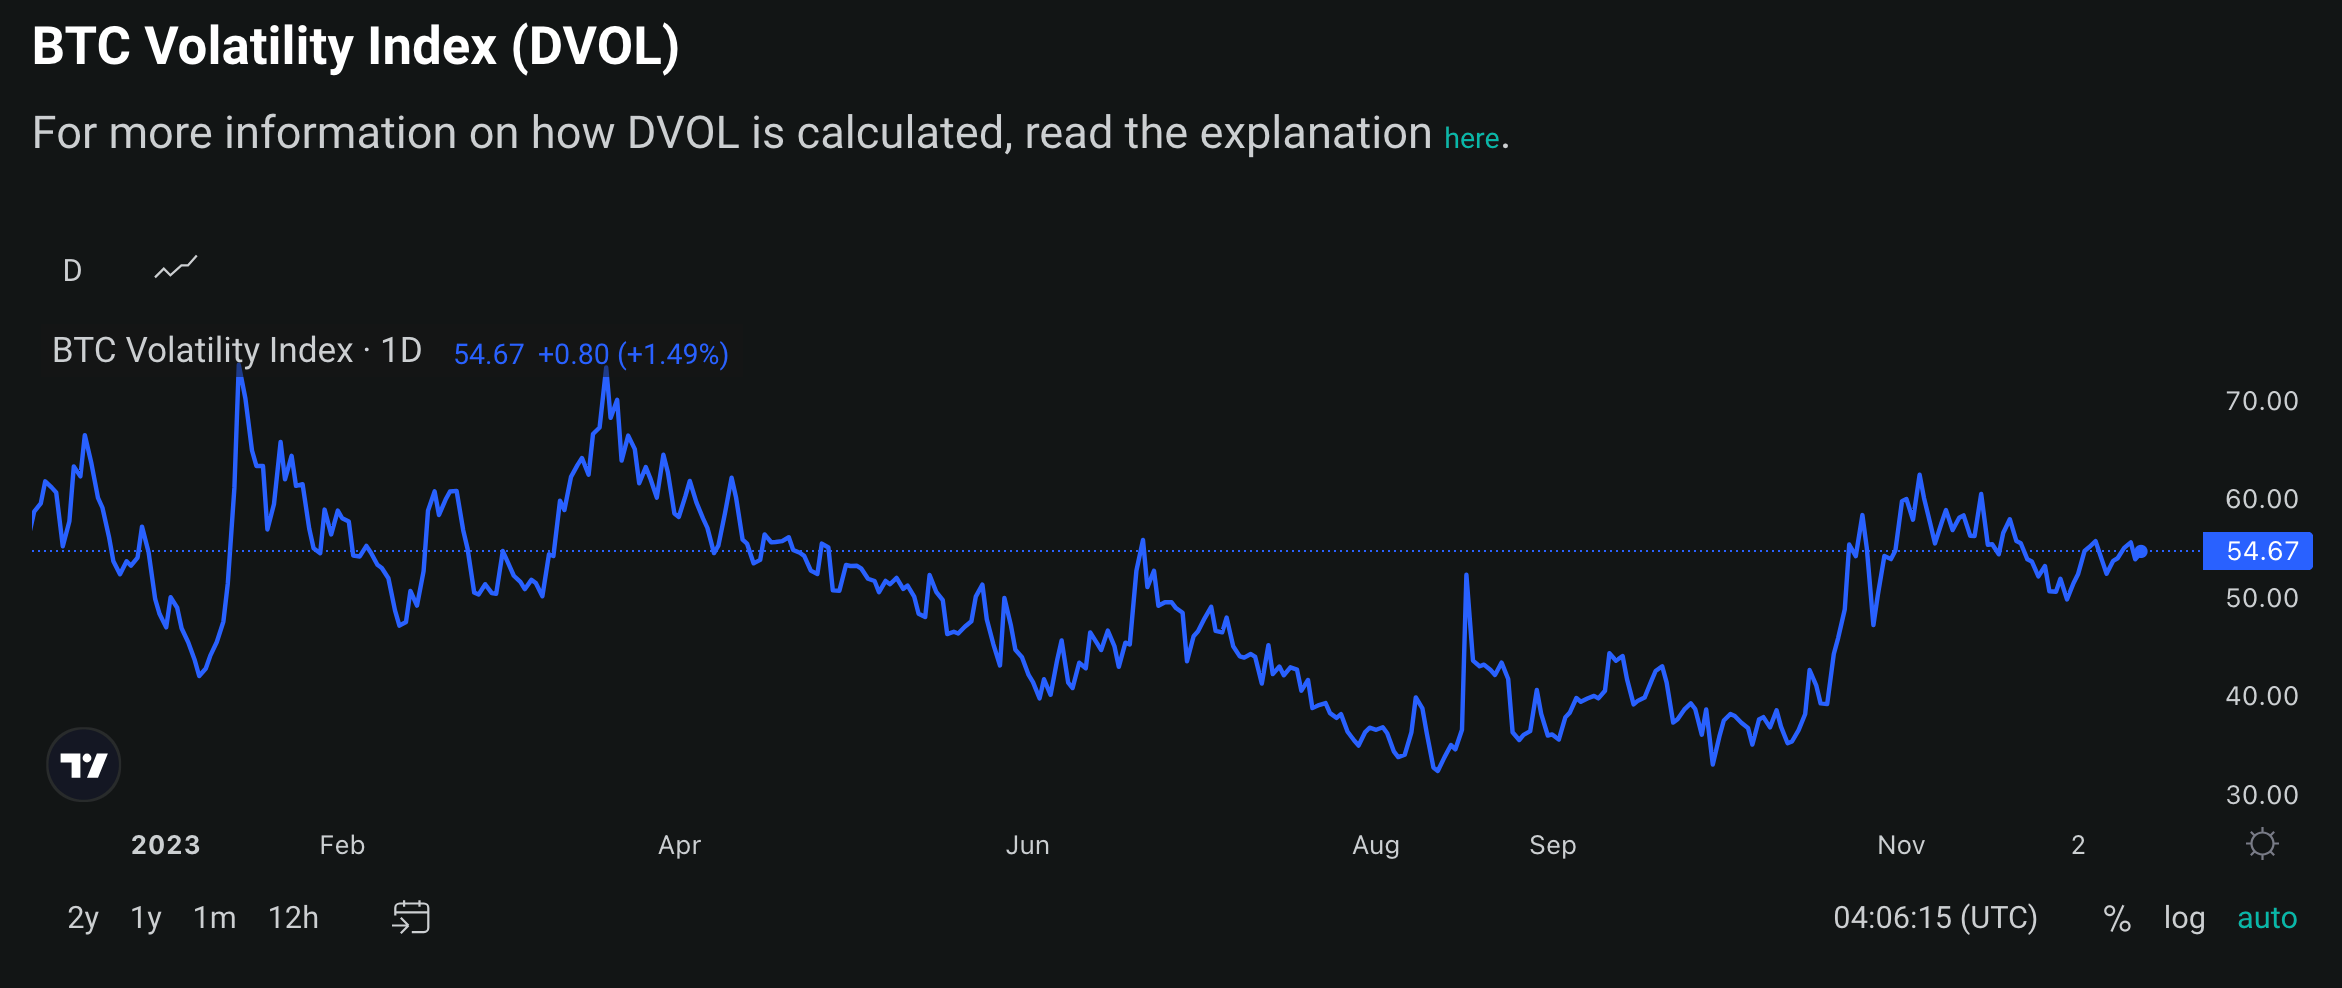
From a time perspective, Bitcoin is still far away from the peaks in 2011, 2013, 2017, and 2021, which marked Bitcoin’s valuation at overheated levels. We believe that Bitcoin is still far from the “overvalued” area, suggesting that the real bull market has not yet arrived, and significant gains are still expected. However, considering that Bitcoin volatility has returned to high levels, a drastic downward correction is difficult to avoid.