Weekly Crypto Market Research and Trade Ideas 9/20 – 9/28
Summary:
- Japan’s largest investment bank, Nomura, launched a Bitcoin Adoption Fund for institutional investors. Link
- Mainnet conference took place in NYC, where we hosted one of the largest networking events.
- Token 2049 took place in Singapore, where Pionex US CEO GJ Tang spoke. Link
- Bitcoin and equities sell-off after Powell outlined higher for longer rhetoric at the FOMC conference. Link
- Our prediction of the FOMC decision being a selling event was accurate, as Bitcoin was rejected at the top of the trading range.
- Coinbase approved to list BTC & ETH perpetual futures trading to users outside the US. Link
- Due to mixed market sentiment, we are inclined towards a sideways trading market.
News Cycle
$500 Billion Asset Manager Nomura Launches Bitcoin Fund
During the past week, Nomura, the largest Japanese investment bank, announced the launch of a Bitcoin fund catering to institutional investors. This fund is structured through Laser Digital Asset Management and has recently received preliminary approval for operation in Abu Dhabi.
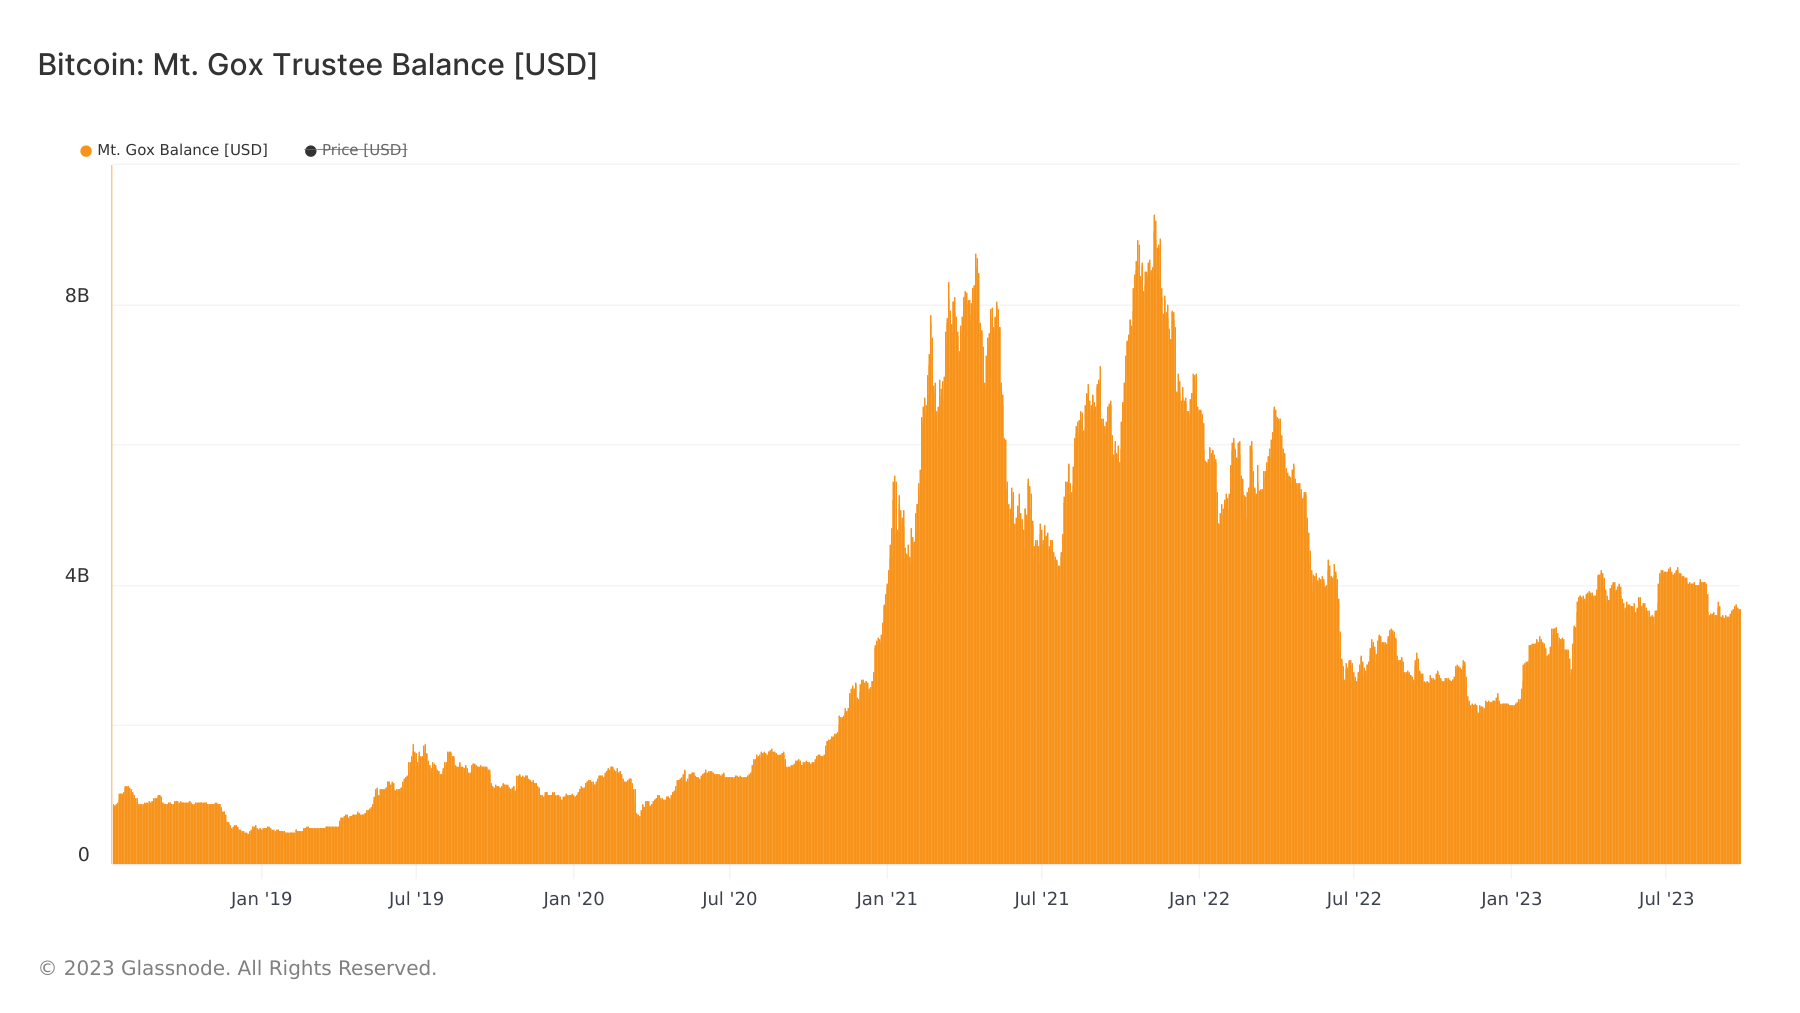
Mt. Gox Release of Bitcoin Moved to 2024, Reducing Expected Sell Pressure
The trustee in the Mt. Gox case filed with the Tokyo courts to extend the deadline for releasing funds to creditors. The court approved this request, and the new deadline is now set for October 31, 2024.
Trading Recommendations
Bitcoin
Futures | Spot
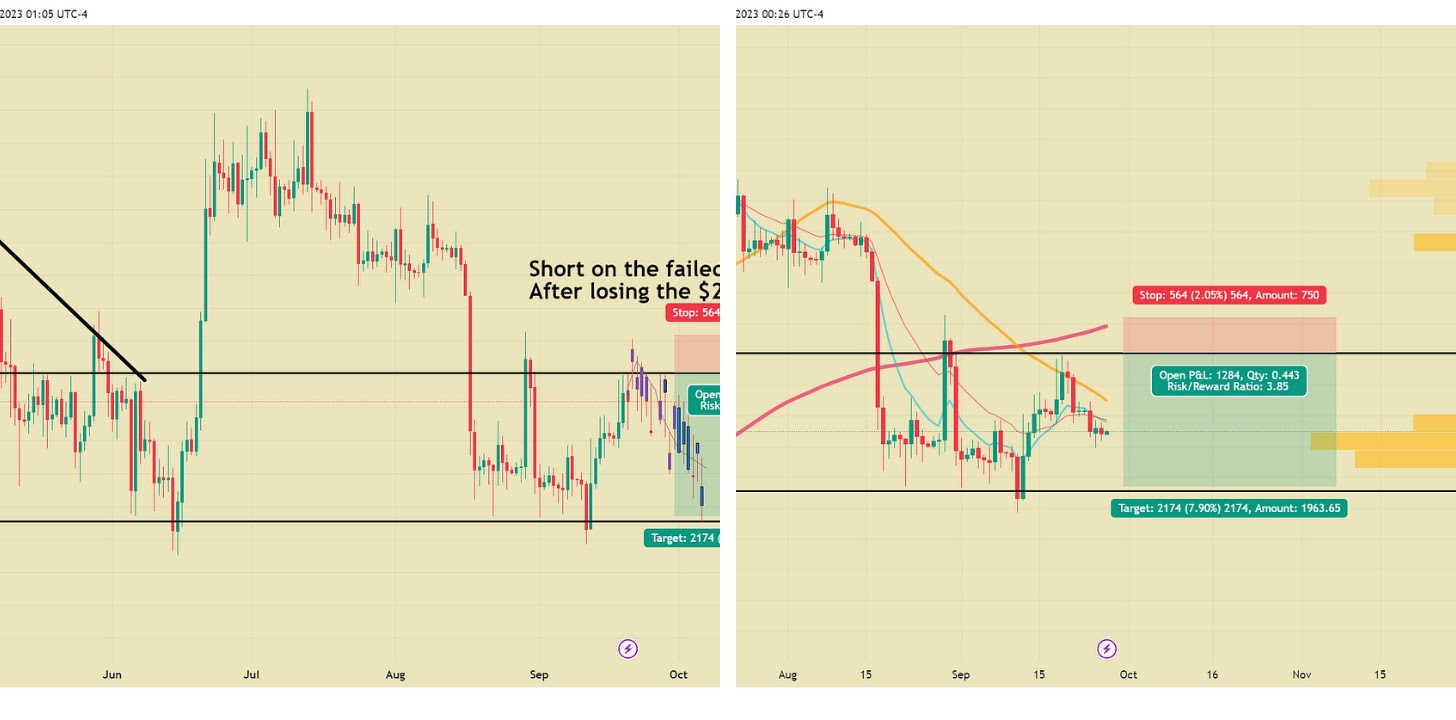
The idea from last week didn’t fully hit its entry point as Bitcoin tested $27,492 several times but never successfully broke above $27,500 and came back under. However, if you followed the idea, we recommend stopping out if Bitcoin daily closes above the 50-day moving average (orange line on the chart below). If you want to take profits early, the target is still at $25,500 or $26,000. At the time of publishing, the price has already increased above the 50-day moving average on the backs of the Coinbase futures approval news and S&P bounce. If it closes above the 50-day we would recommend exiting the trade.
Structured Product
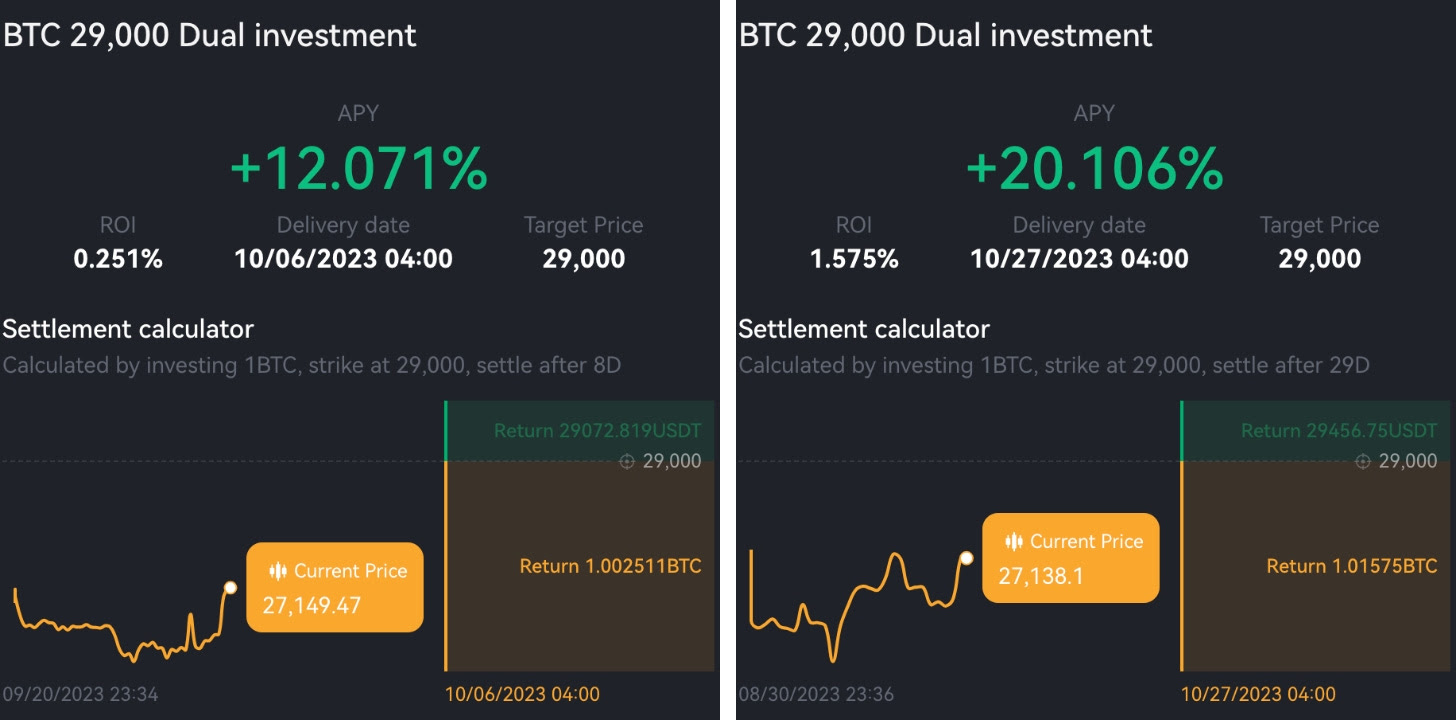
Last week, we recommended a longer-term covered gain strategy with a strike price of $29,000. This proved profitable, and we are still far from $29,000 with between 7 and 30 days to go, depending on your chosen date. We believe those trades are still good, especially with this rally in Bitcoin causing premiums to spike. The updated prices are below.
Macro Analysis
Dynamics in the Dot Plot
The outcome of this FOMC meeting did not come as a surprise to most. According to the dot plot report, out of the 19 decision-makers, 12 support another interest rate hike this year, a proportion that exceeds most expectations. Additionally, their predictions for future interest rates have also changed.
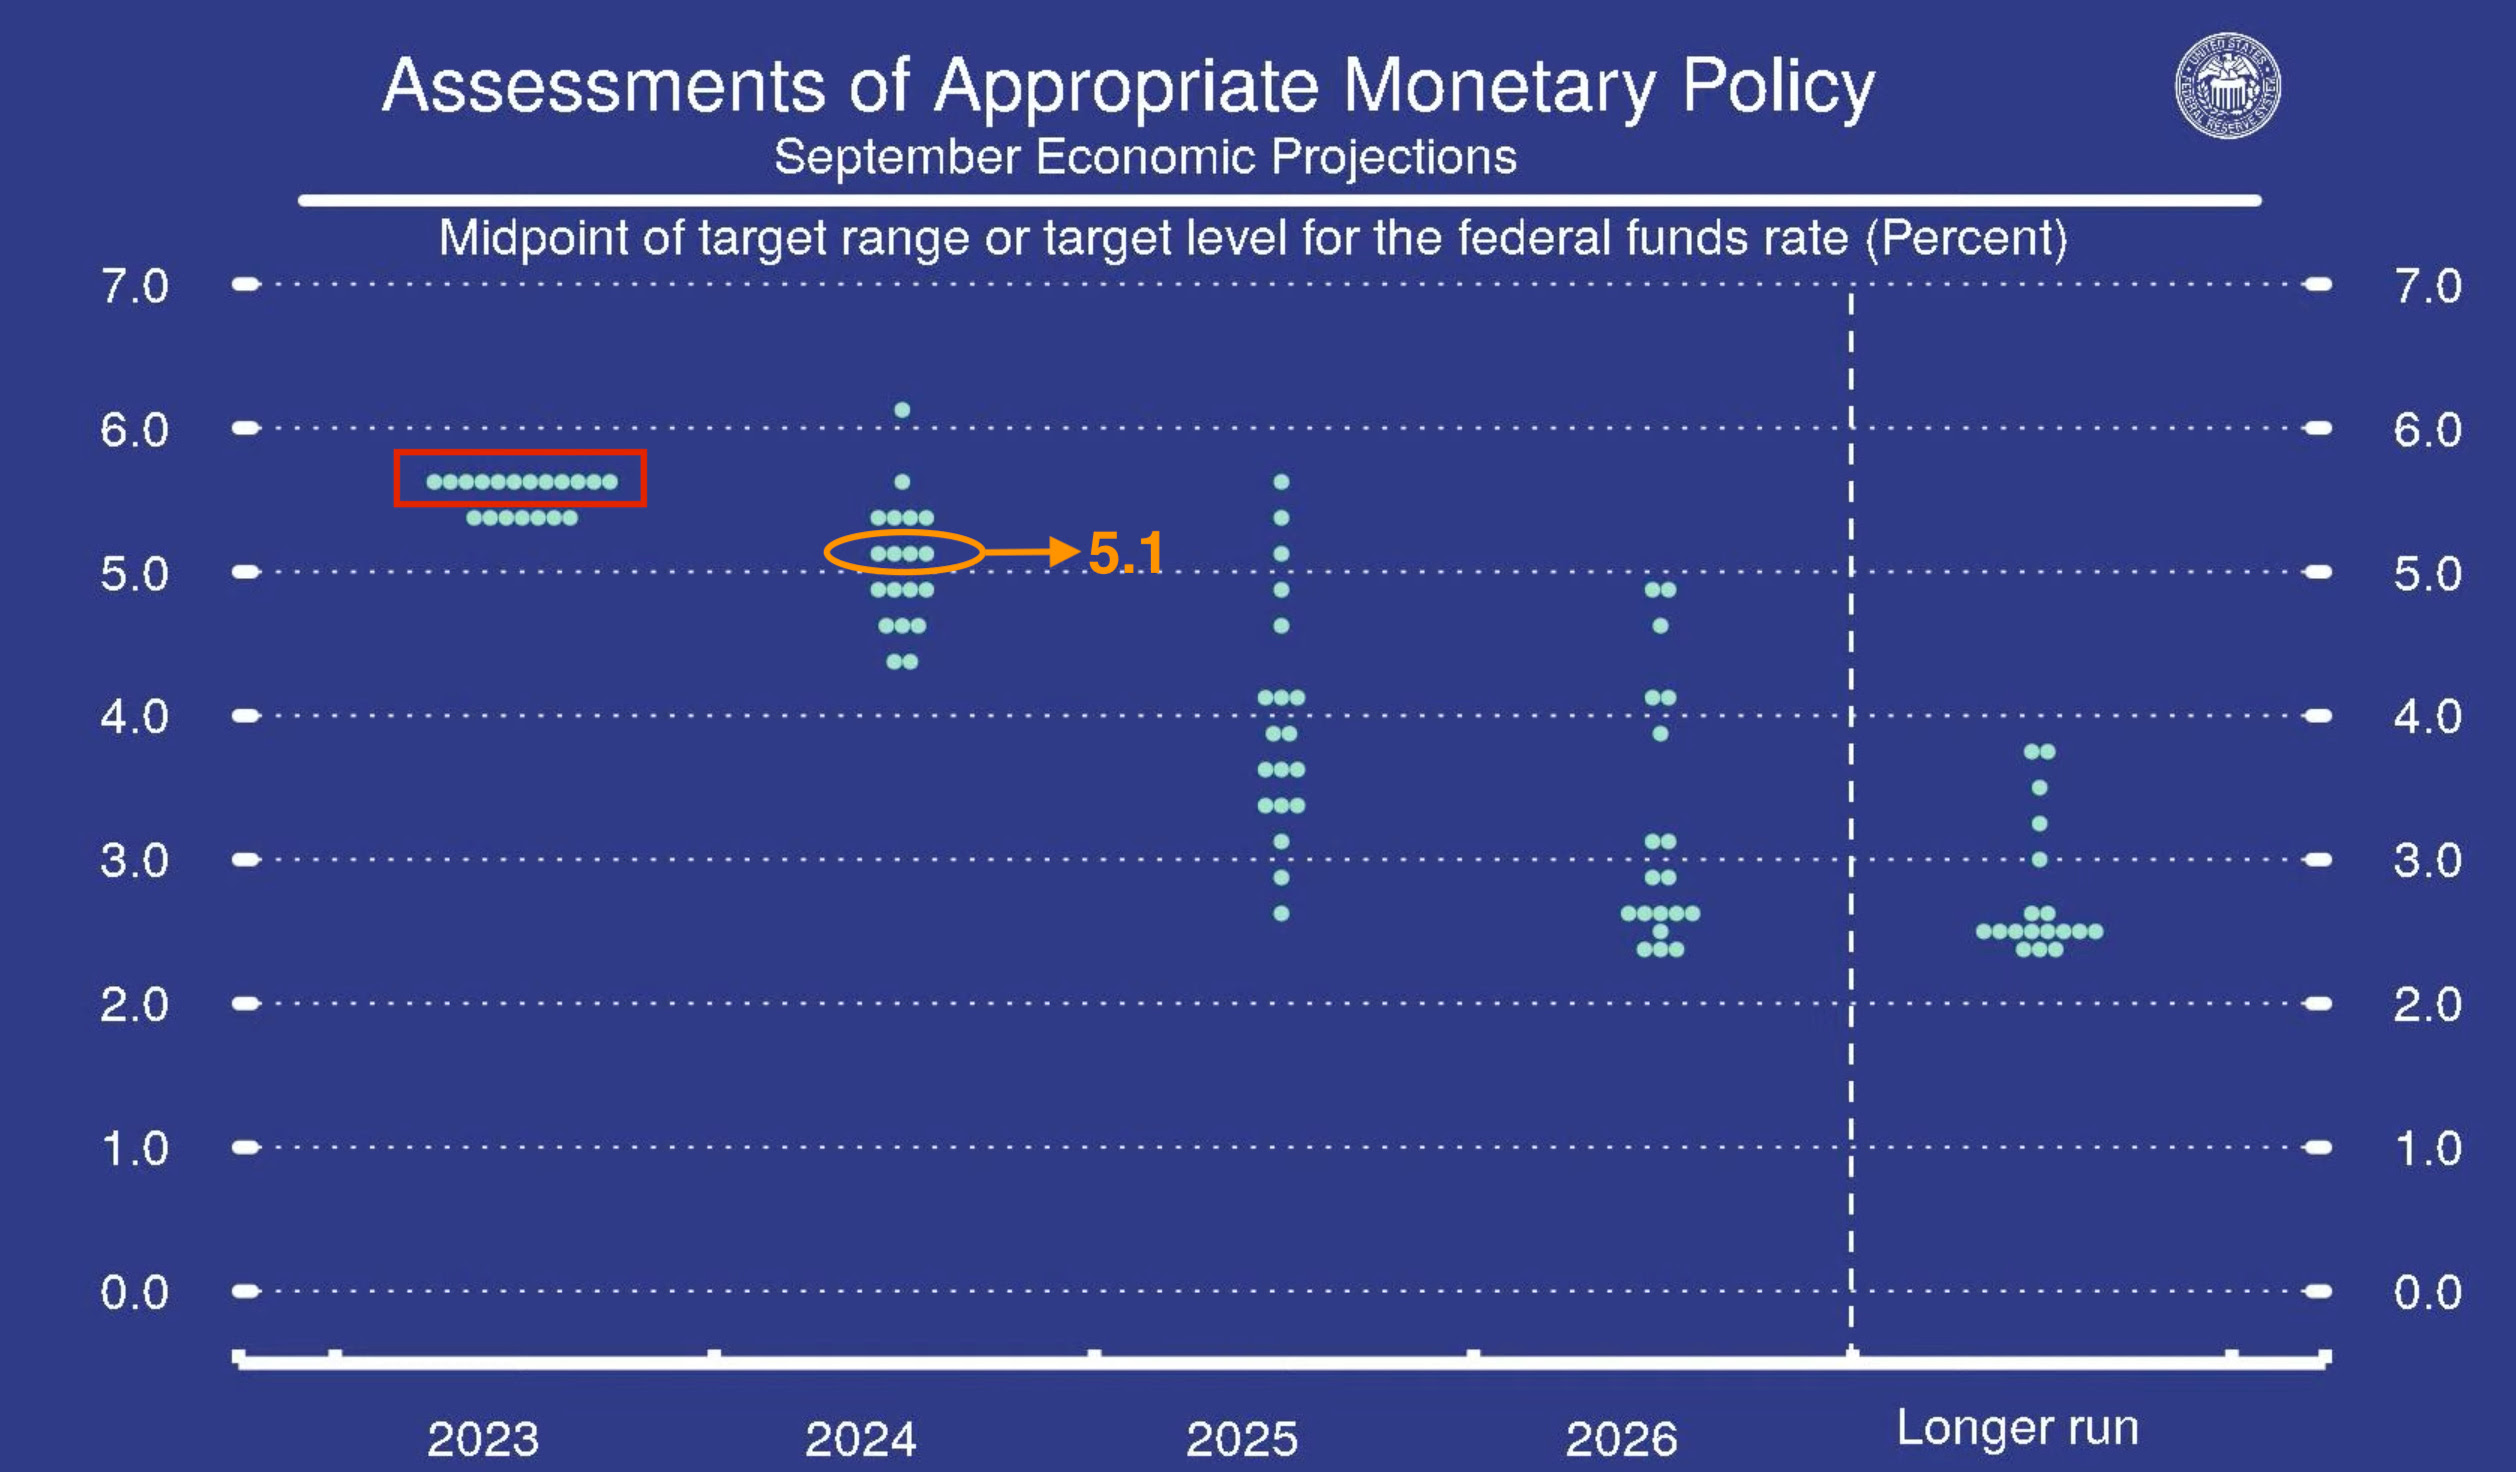
The dot plot reveals that out of 19 decision-makers, 12 support another interest rate hike this year, with a median rate expectation of 5.1% for 2024.
In previous forecasts, it was anticipated that by the end of 2024, the Federal Reserve’s interest rates would reach 4.6%, with market expectations for the peak rate at around 5.5%. This implied that the market originally expected a 100 basis point cut next year, following the Federal Reserve’s usual 25 basis point reduction pattern, potentially resulting in four rate cuts.
However, this FOMC meeting has led to adjustments in these predictions. Federal Reserve officials have revised their year-end 2024 interest rate projection to 5.1%, leaving only 40 basis points for potential cuts. Based on the usual 25 basis point reduction, the market now anticipates only two rate cuts next year.
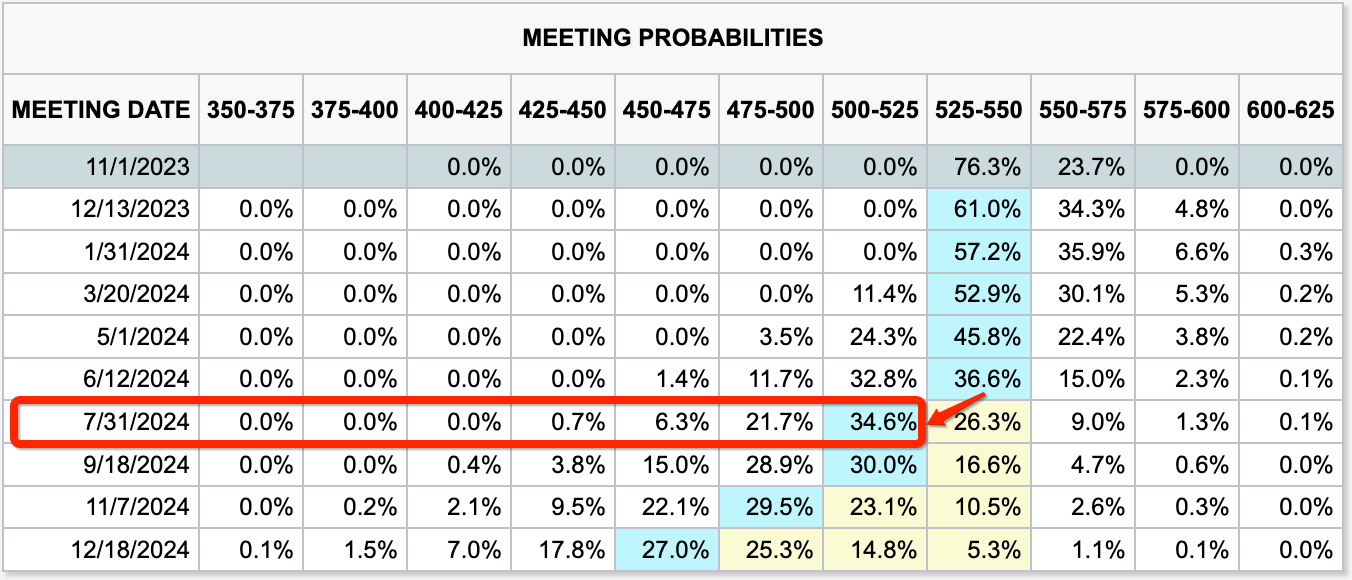
As expected, the market has once again delayed expectations of a rate cut by the Federal Reserve. Meanwhile, the market has also delayed its expectations for when the Federal Reserve will implement rate cuts. According to CME FedWatch Tool data, the market now expects the Federal Reserve to cut rates in July 2024. This implies that high rates will remain “higher for longer.”
Latest Developments on ETFs
The SEC has again postponed its decision on the ETF proposal from ARK Invest, led by Cathie Wood. We believe this significantly reduces the likelihood of ETF approvals this year. If the SEC has delayed its decision on ARK, other applications may face similar delays. Applications from BlackRock, Bitwise, VanEck, Invesco, Wisdomtree, Fidelity, and Valkyrie are expected to be processed in mid-October.
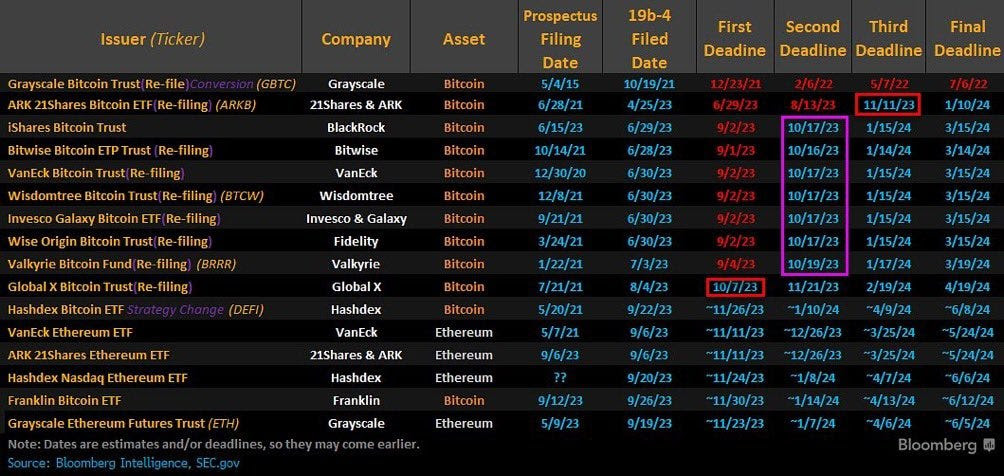
We maintain our long-held view that, given the current situation, it’s highly unlikely for a Bitcoin spot ETF to be approved in 2023. Even in the recent lawsuit won by Grayscale, the judge merely requested the SEC to reconsider these applications, indicating that the application process remains arduous.
Strong Headwinds
Cryptocurrencies like Bitcoin and Ethereum are facing strong headwinds.
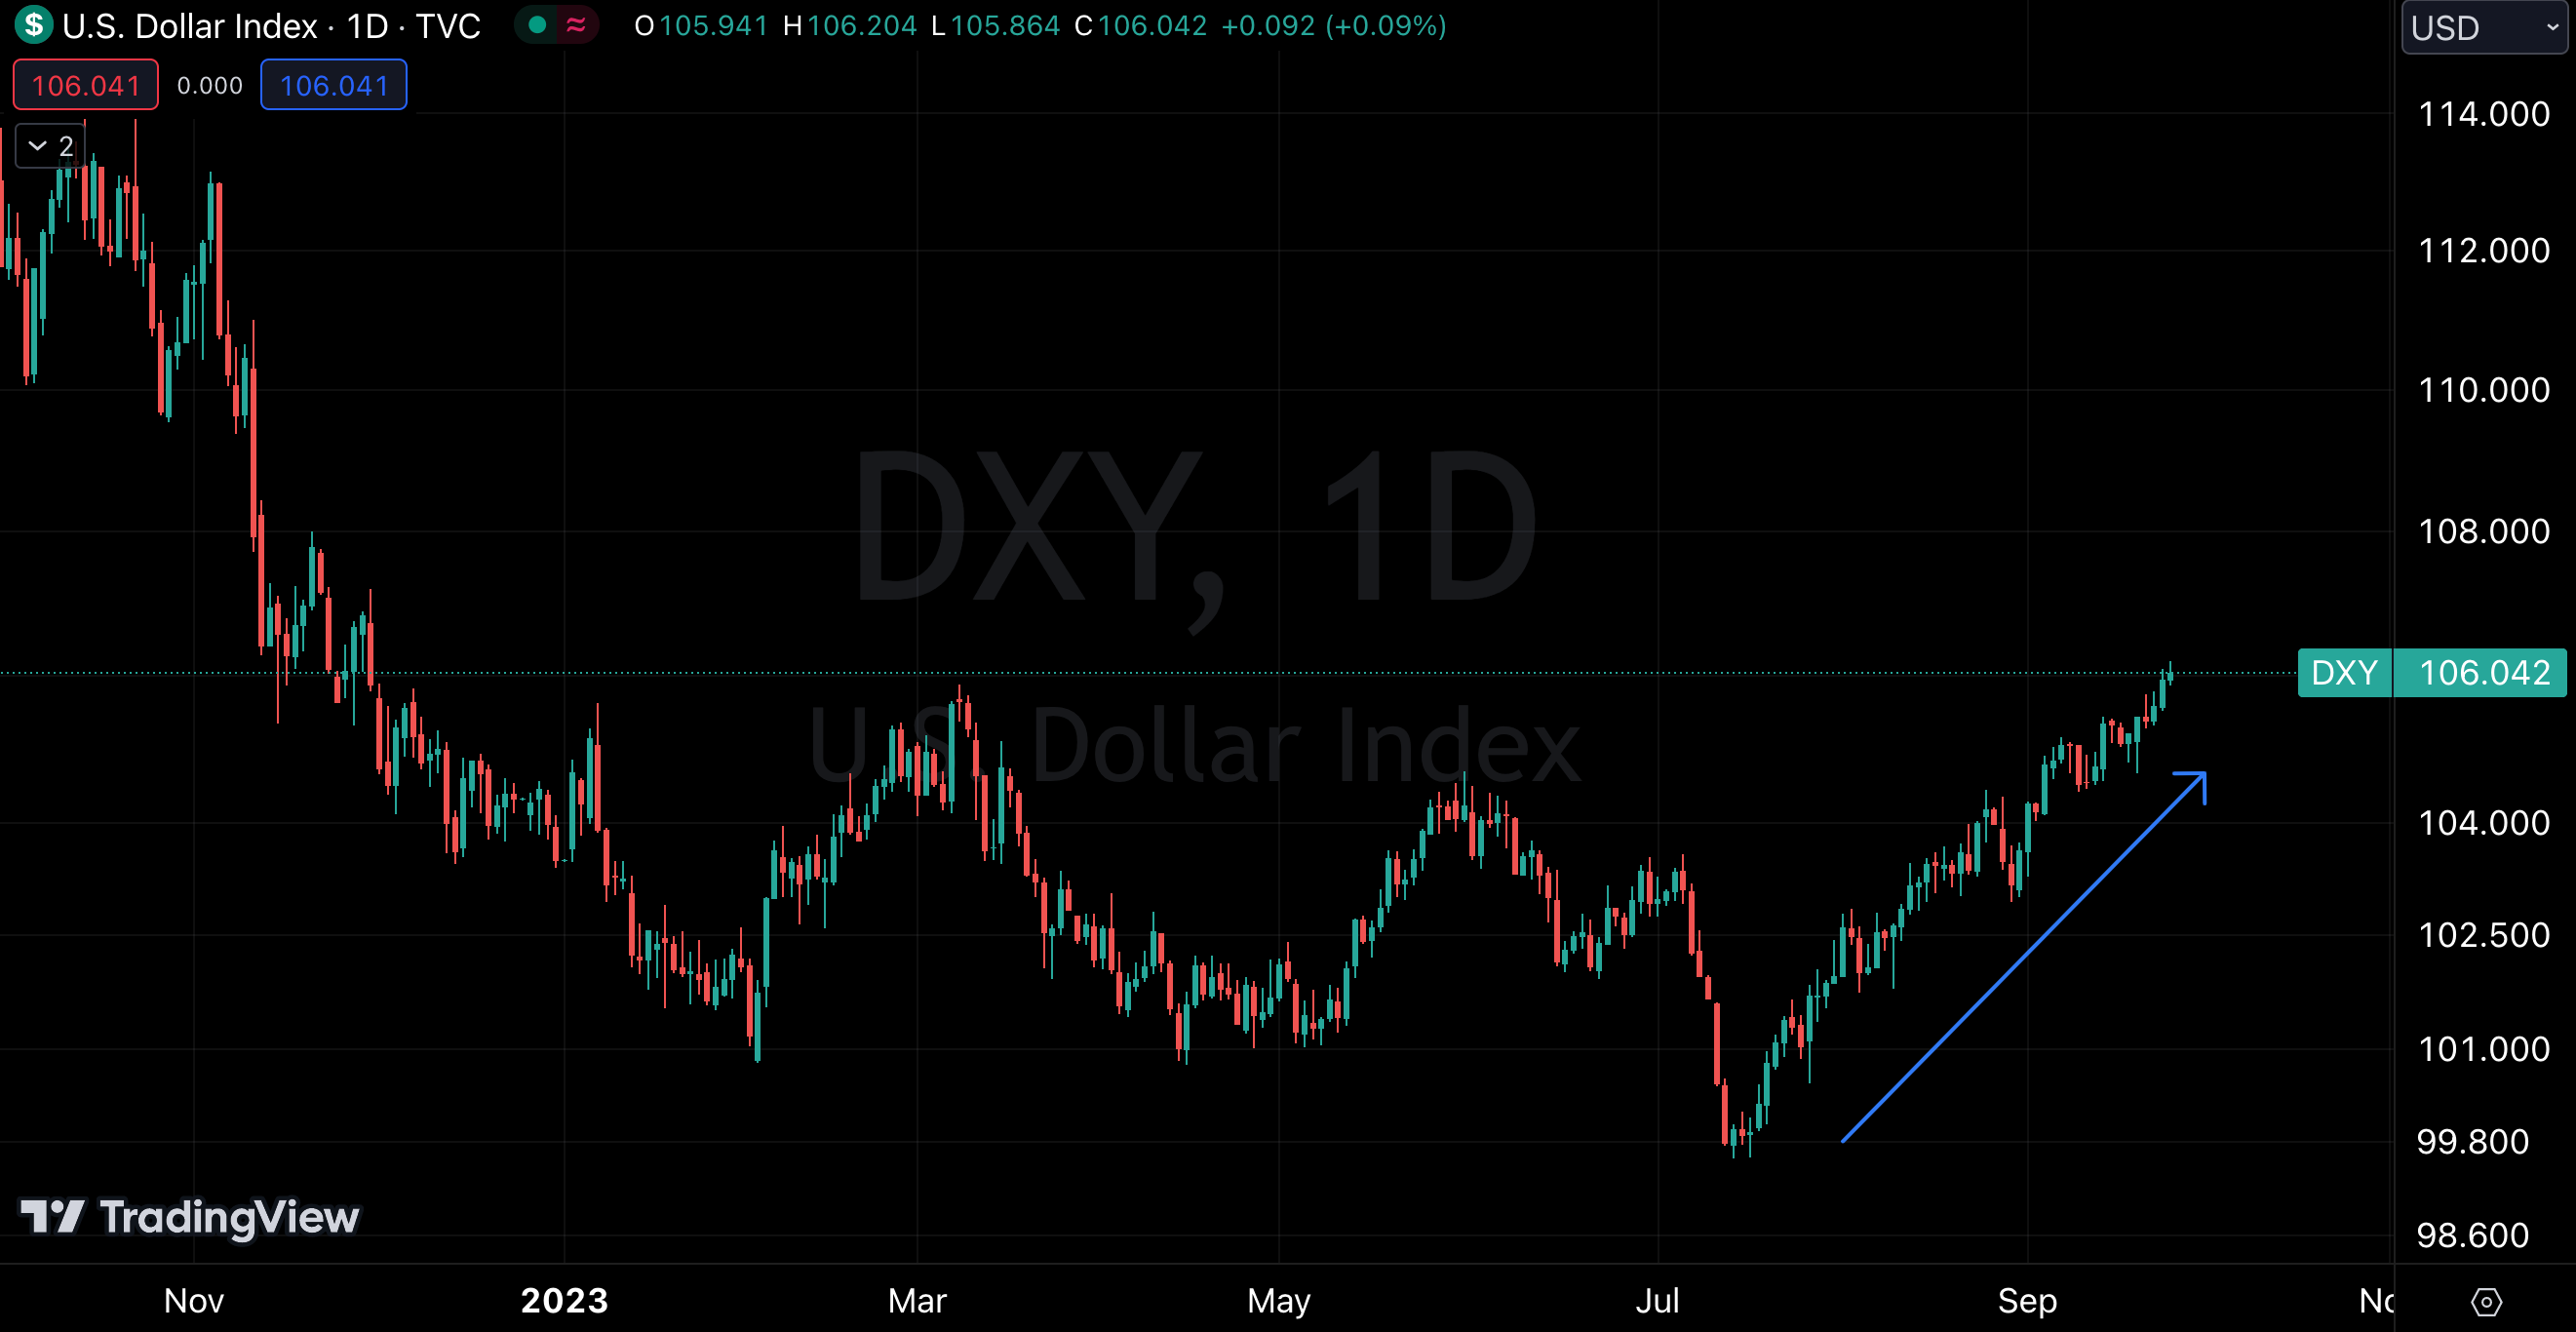
After experiencing a deceptive surge to $31,000, the current trajectory of the cryptocurrency market is not optimistic. The strength of the US dollar and US stocks is causing capital to flow out of the cryptocurrency market as investors turn to more stable assets such as US treasuries.
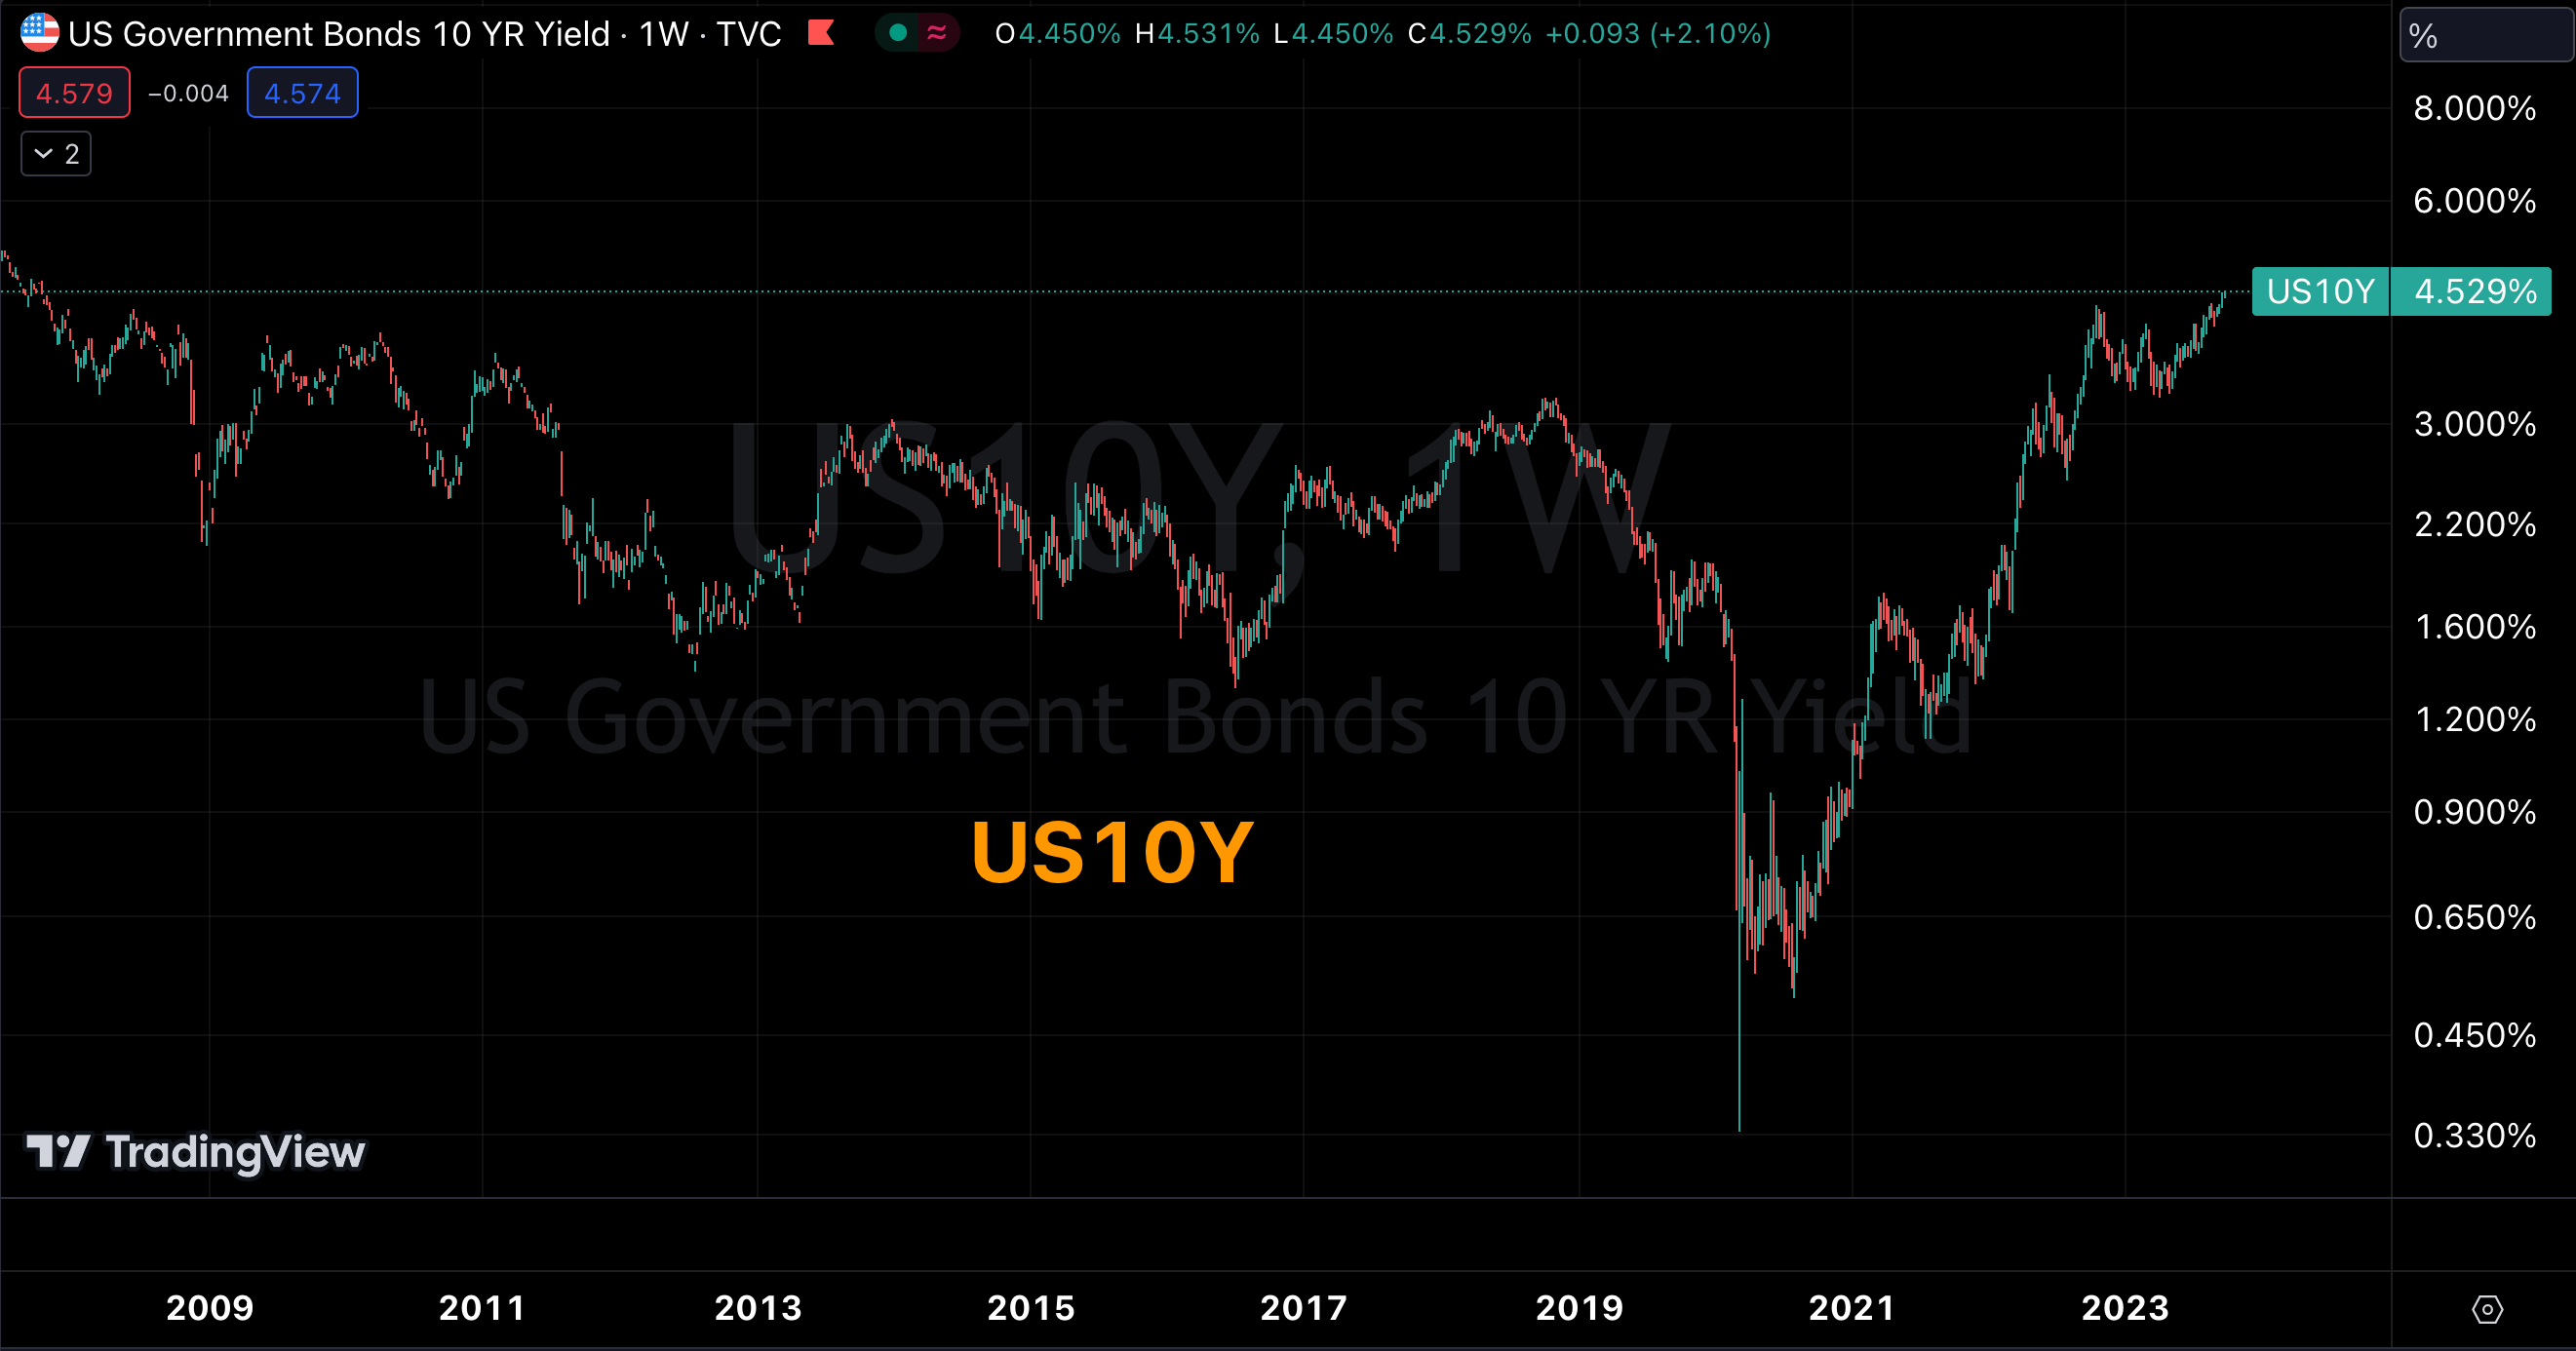
In the past week, the US dollar index and US bond yields have continued to rise, showing no signs of weakening but rather strengthening. Risk assets like cryptocurrencies, stocks, and high-yield bonds continue to be under pressure in this environment. The rise in the US dollar index and US bond yields reflects market expectations of resilience in the US economy, which will somewhat bolster the attractiveness of the US dollar and potentially put pressure on risk assets. Most investors in this situation will likely reduce their investments in risk assets and seek more stable and secure assets.
At the same time, the delay in the launch of spot ETFs is causing a lack of consensus on the timing of the crypto market, and liquidity shortages continue to constrain substantial market changes. This undoubtedly increases the risk for those holding and investing in cryptocurrencies.
However, we believe that these changes do not necessarily indicate a definitive trend in future interest rates. In fact, due to uncertainties in global macroeconomic factors, such as expected regulatory policy changes and changes in the macroeconomic environment, there remains a certain level of variability in market expectations for cryptocurrencies. With the current market being divided, factors like the upcoming Bitcoin halving, the delayed launch of Bitcoin spot ETFs, and the Federal Reserve’s reluctance to exit its tightening policy all contribute to clear headwinds and tailwinds. Therefore, we lean towards a market characterized by sideways fluctuations. Of course, when considering potential market risks and opportunities in the future, investors need to take various factors into account.
Technical Analysis
BTC Rejected From Resistance
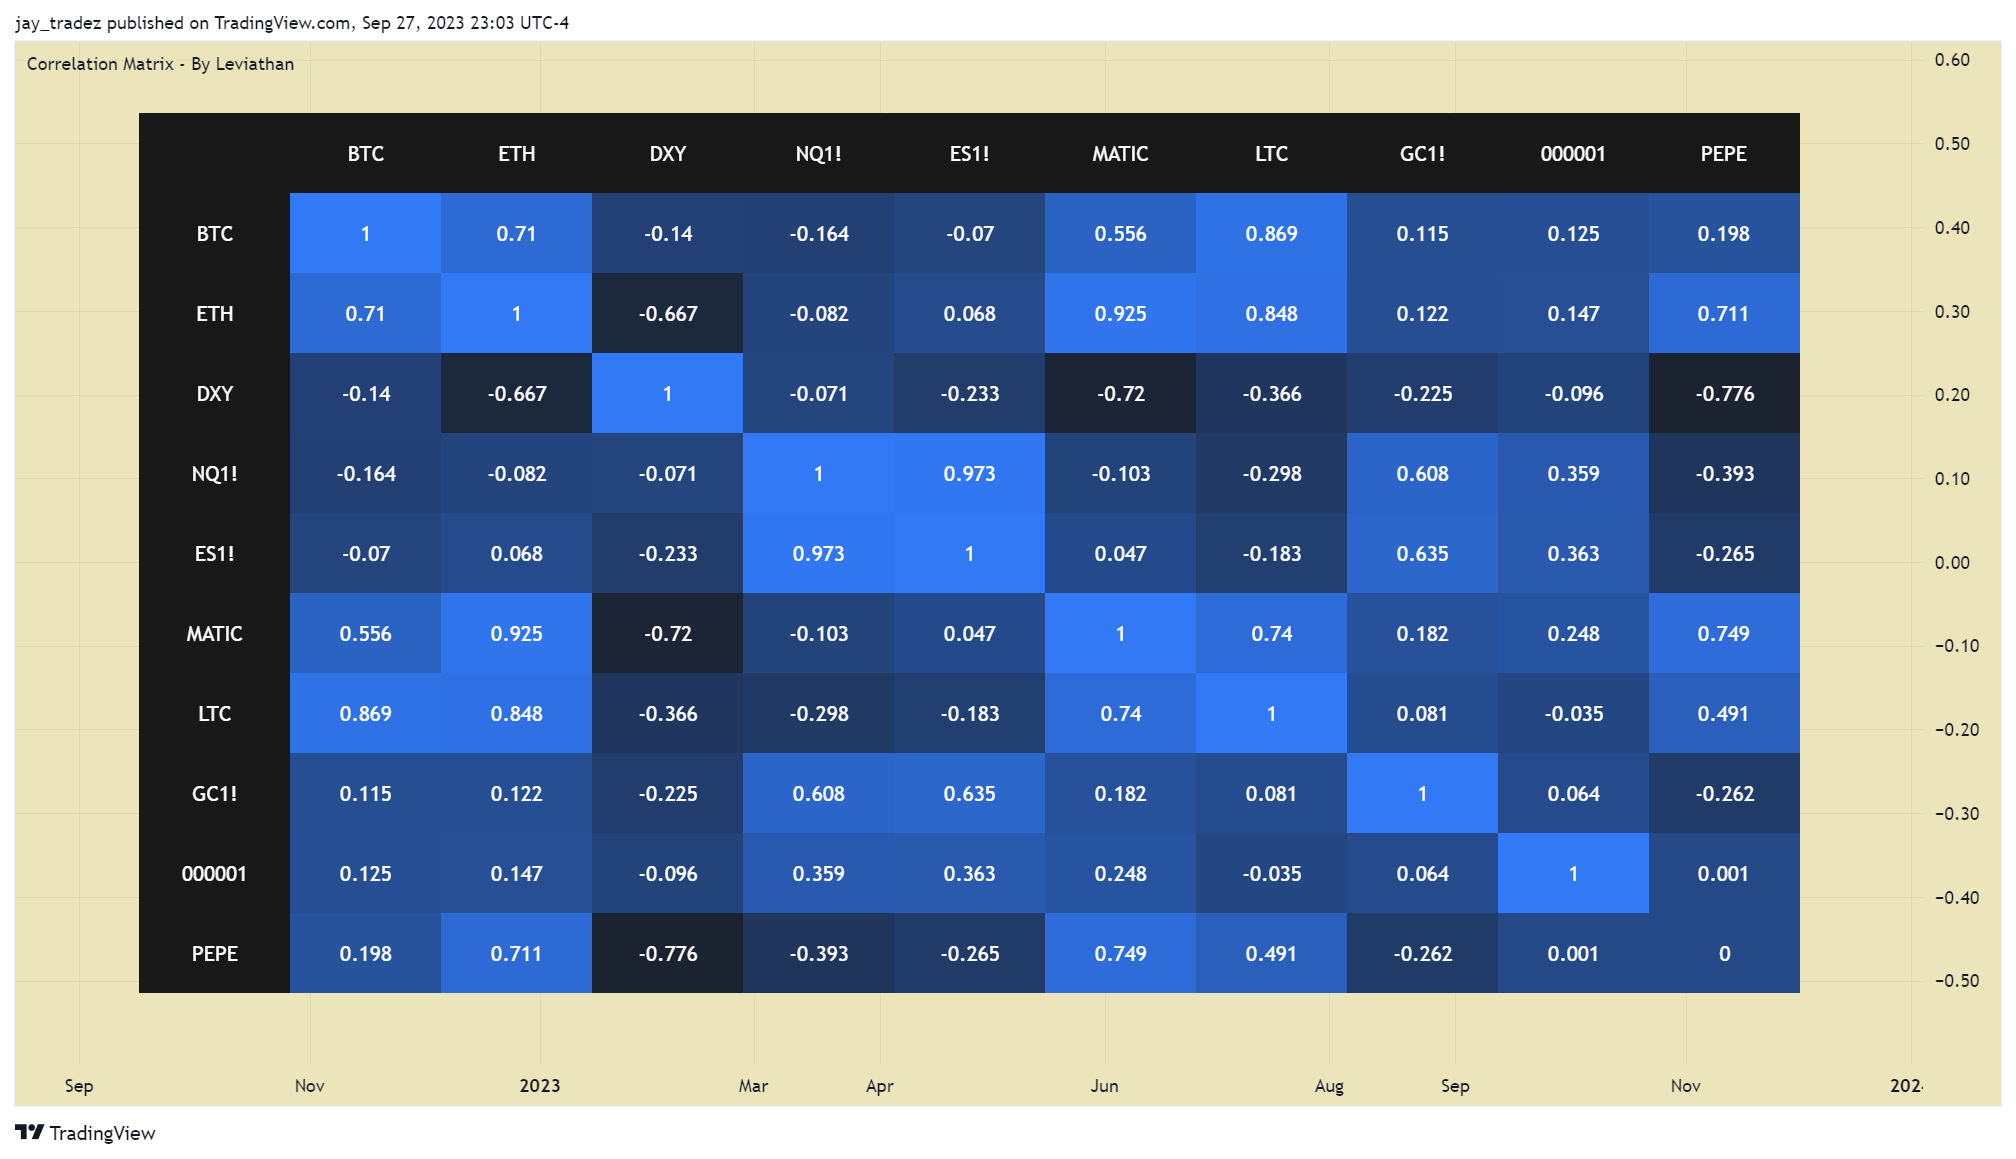
Last week, we recommended “selling at $28,000 or current market prices.” This was due to the FOMC meeting and our view that only negative reactions would likely come from it, plus $28,000 being a solid level of selling pressure/resistance, which would also be negative pressure. One positive sign is that even with the rapid decrease in equity markets, Bitcoin has been holding on strong. The current correlation coefficient is -0.07, meaning there is no correlation between the price of Bitcoin and the S&P500 at current.
However, as you’ll see in our analysis below we believe the S&P is coming into a strong level of technical support and will likely get a relief bounce in the short-term. While contradictory to the correlation above, this might bring some positive demand for risk assets such as Bitcoin. At worst, nothing will change, and Bitcoin will keep consolidating. At the current price levels, we can start looking for higher lows to see if we can get a change in trend. Our prediction from a month ago has it testing $25,000 lower channel support and flip-flopping between $25,000 and $28,000. However, that was 1 month ago, and current conditions could change anytime. While we don’t see any events that will conclusively represent such change, it is good to be ready for different scenarios.
- Bullish: We have to be ready for a reclaim of $27,500. This should be on the backs of news or an S&P500 bounce.
- Current: Bounce between $25,500 and $27,500.
- Bearish: We go under $25,500, invalidating the failed breakdown.
Based on Benjamin Cowen’s bull-market support band, a mixture of the 20-week SMA and 21-week EMA in every previous bear cycle, we have had a break above it and subsequent failure to hold above. In the charts below, you can observe each case in 2015, 2019, and current. Based on this indicator, in combination with historical data, we should have a run-up into the support band of ~27,500 and then continue lower. However, this is just another viewpoint, and we should give more weight to current price action than historical patterns. 2015, 2019, Current
SPY bounce level
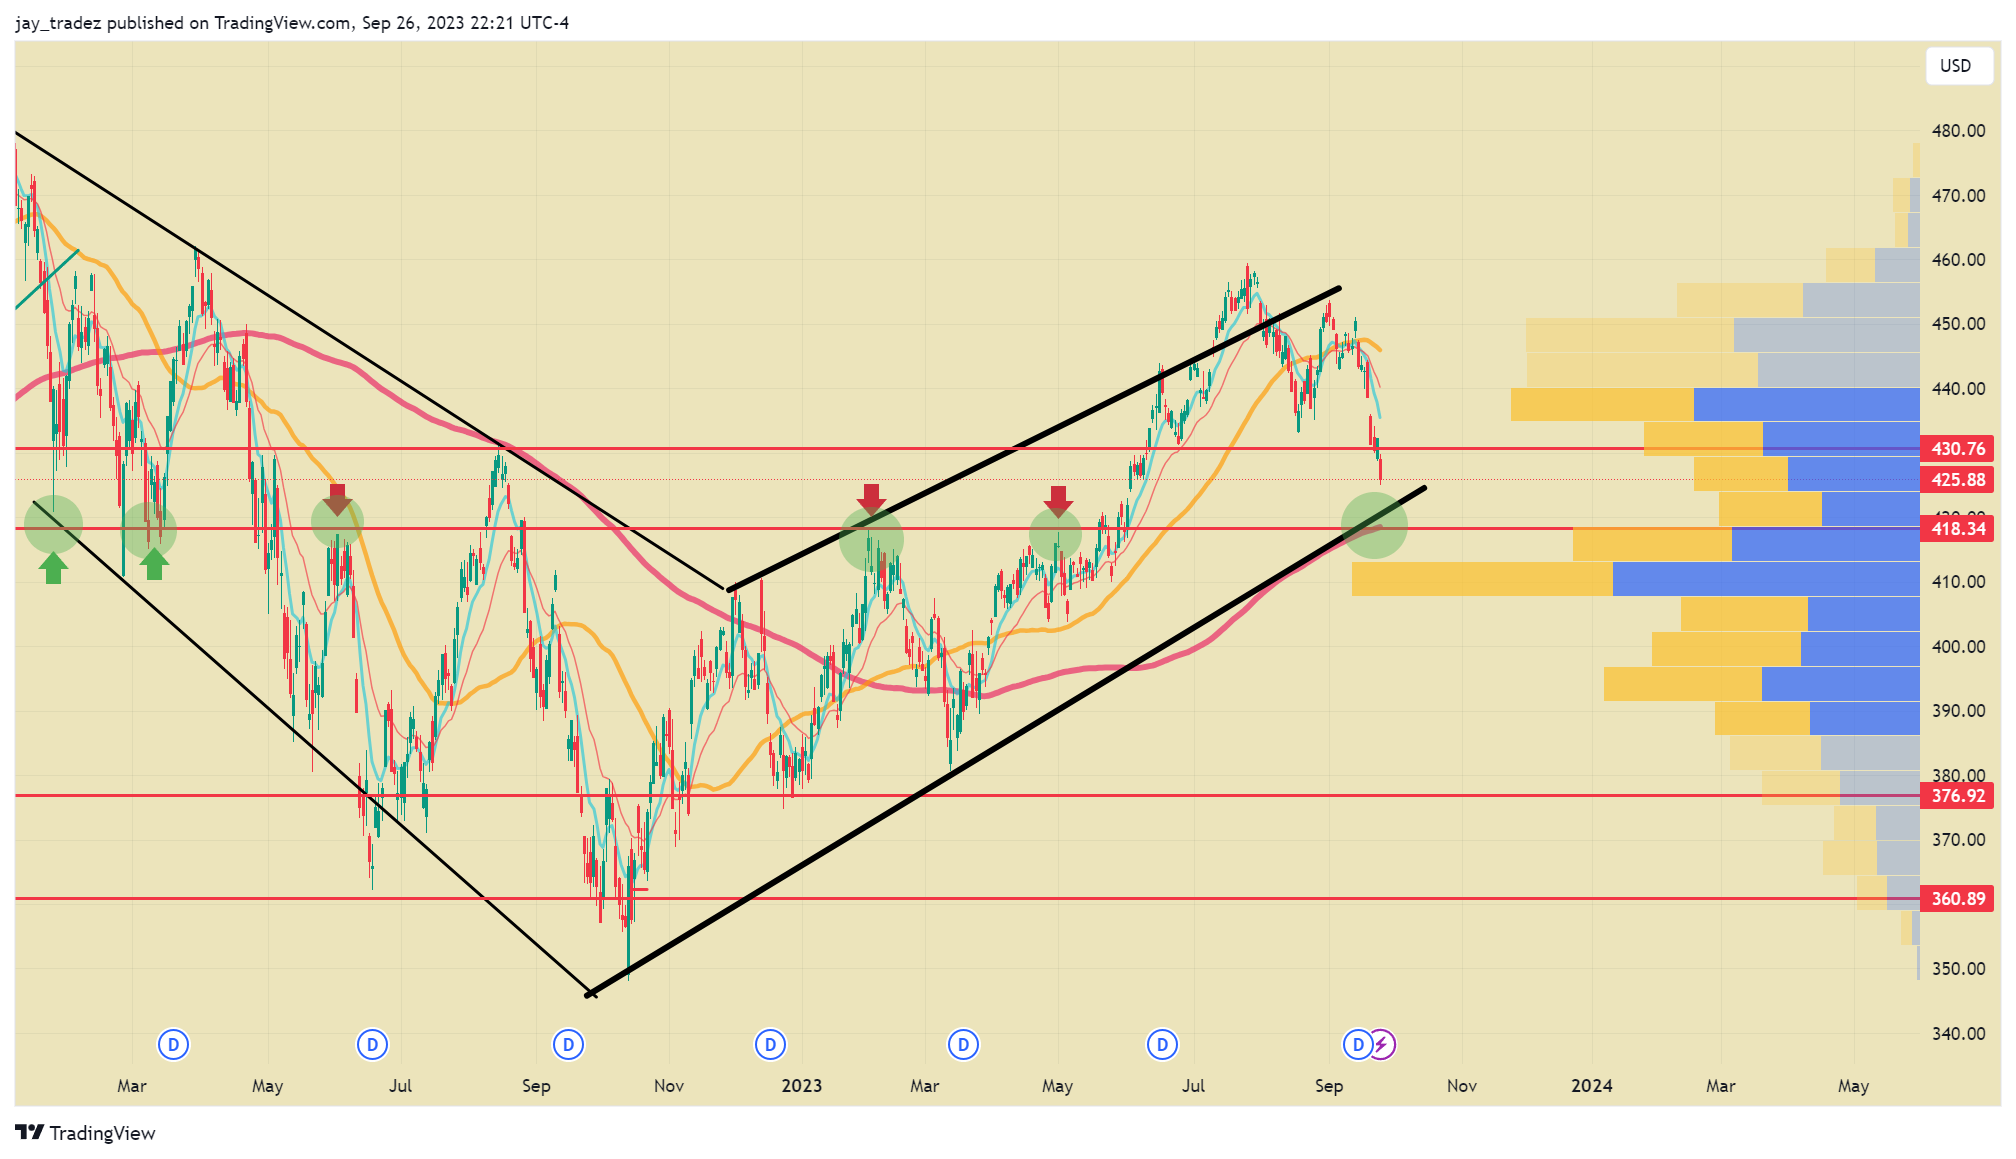
Most of the action this past week has been on the equities market, and bears have come out of the woodwork with this decline in the equities. It is now acceptable to be discussing the negative economic data and questioning if a recession will come. Factors in focus are pressure from higher rates, higher default rates, student loan payments resuming, the UAW strike, a potential government shutdown, a strengthening dollar, and more; it is easy to see why the market has been selling off. The next technical level on the chart that is of importance is the 418 level, where a bounce is highly likely. This has 3 factors of support: the 200-day MA, the major trendline support from the primary trend, and an area of investor interest underneath. We don’t see this area being easily broken, especially with DXY and Crude Oil both running into an area of resistance which could act as relief for the SPY.
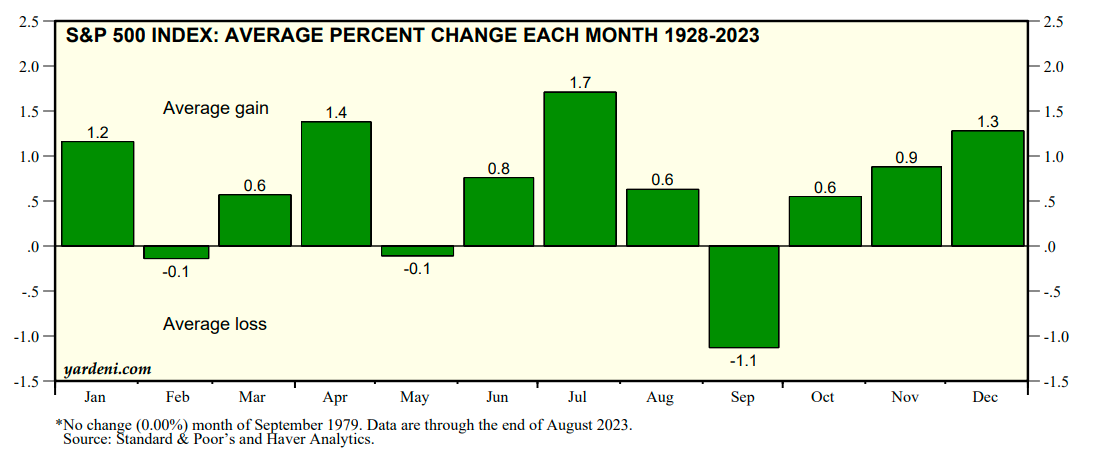
September is historically a bad month for equities, with a 1.1% drawdown on average. We have already had a 5% drawdown this month, so are we likely nearing the bottom for a bounce? While we have had a relatively large drawdown, if we look at this in terms of ROI instead of just percentage moves, this 5% drawdown brought us back to the average ROI during election years.
Typically, we observe a bottoming out in bonds before witnessing a reversal in risk assets. This phenomenon occurs because the bond market is larger and tends to have fewer retail participants, making it a more informed market. Therefore, we usually receive some signal of a bottom in bonds before seeing a reversal in equities.
Currently, there is a gap down on the TLT, representing medium to long-term government treasury bonds, which appears to be in the process of reversing. This coincides with the 10-year rates reaching a range of 4.6% to 4.7%, a level not seen in 15 years.


TLT vs 10 YR
