Contents
Summary
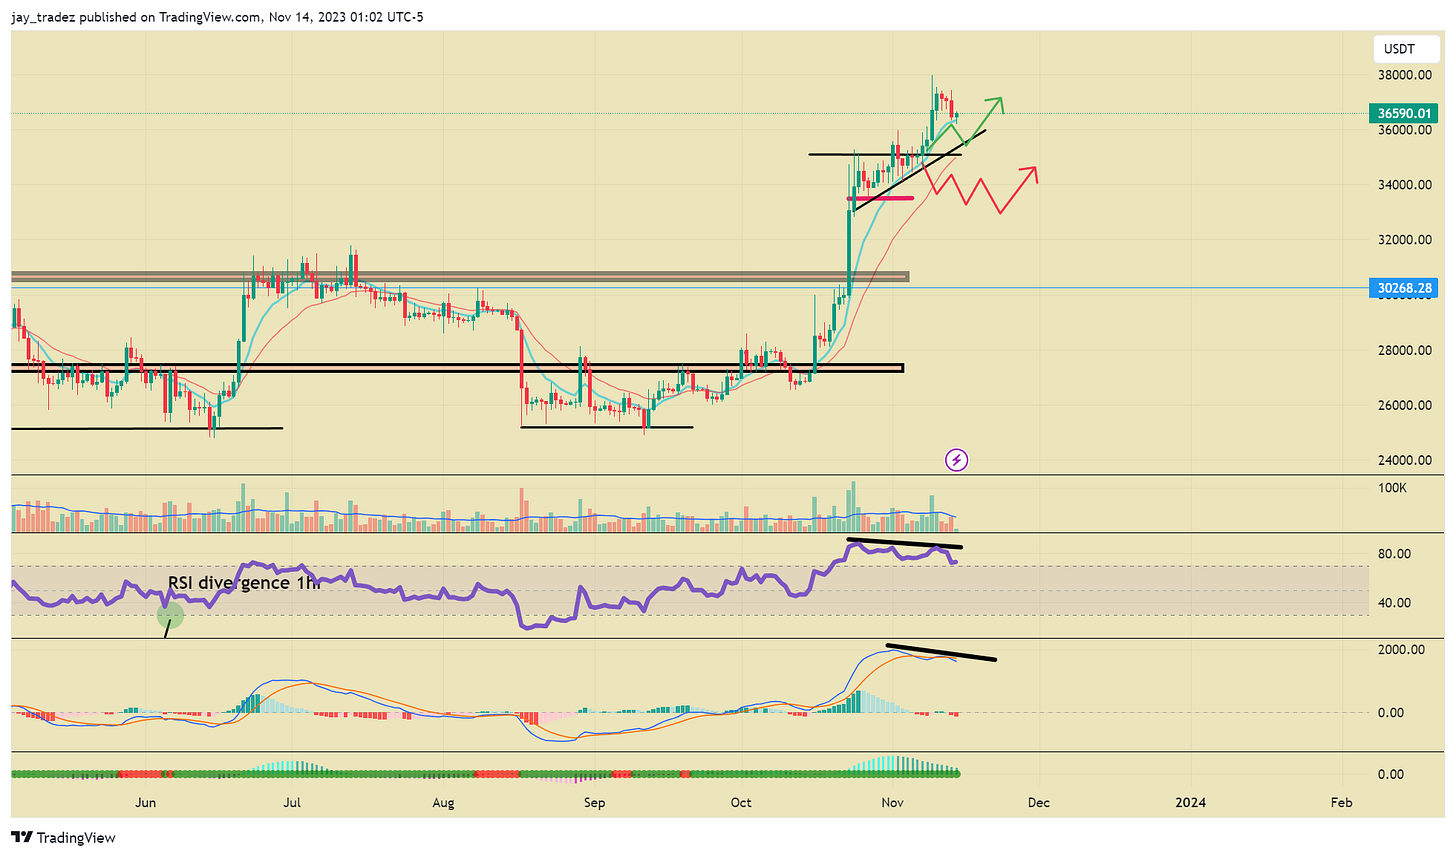
- We see a bearish divergence on the RSI and MACD. Unless we are in a full-blown bull market like at the end of 2020, this usually leads to shallow pullbacks.
- Blackrock has plans to file for an Ethereume ETF. This drove outperformance in ETH. We outline some scenarios below we want to see to determine if the ETH/BTC pair has bottomed.
- TVL has come out of its cooldown phase, and if upcoming data confirms that market fundamentals are still on the upswing, the bull market is set to persist in a sustained fashion.
- A significant surge in the overall count of fresh Bitcoin addresses has occurred on the blockchain. However, major Bitcoin holders are cashing out their positions with gains, while individual investors are jumping in due to FOMO, trying to keep pace.
- Opting for GBTC as an investment seems prudent to secure a more profitable dual return than solely investing in BTC spot.
Weekly Highlights
- Spot Bitcoin ETF Progress!
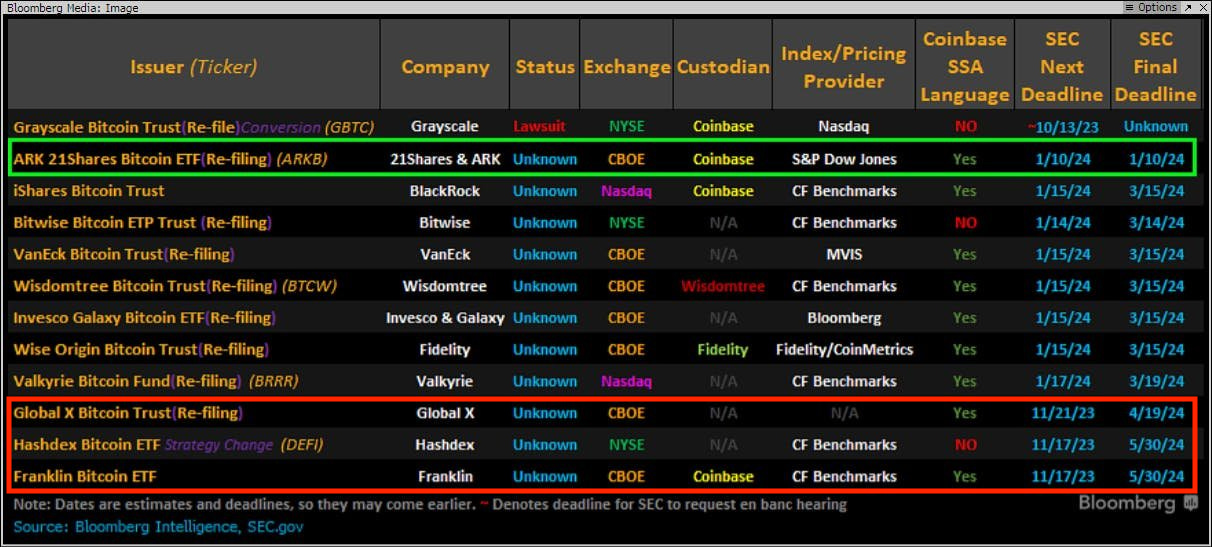

ETF analysts James Seyffart and Eric Balchunas believe there’s a ‘window’ between November 9th and November 17th for the SEC to approve all 12 spot Bitcoin ETF applications, including Grayscale’s conversion of its GBTC trust product. They stress that this is only a possibility. The tight timeframe is due to the SEC setting November 8 as the comment period deadline when extending it for some spot Bitcoin ETF applications. After November 17, the comment period for three applications – the Global X Bitcoin Trust, the Hashdex Bitcoin ETF, and the Franklin Bitcoin ETF – will restart (boxed in red), meaning decisions won’t be made until at least November 23. While the window for accepting all 12 applications ends on November 17, Seyffart notes that technically, the SEC could decide on nine of the 12 applications at any time before January 10 (green boxed line). While approval for the Bitcoin Spot ETF isn’t guaranteed, Seyffart and Balchunas predict a 90% chance of approval by January 10 next year.
- Shades of Gray Funds Expected to Take Another Step
Regarding the Grayscale Investments’ conversion of its trust product GBTC into a spot Bitcoin ETF, the SEC discussed details with them on November 9. Grayscale’s Chief Legal Officer, Craig Salm, mentioned an ongoing and constructive dialogue with the Trading and Markets department. Notably, this discussion happens before the court addresses the SEC’s previous “arbitrary and capricious” ruling. All parties are progressing with the filing process, and the SEC hasn’t made any comments.
- Ethereum Spot ETFs on the Agenda
Moving to Ethereum Spot ETFs, Nasdaq filed an application on November 10 with the SEC for a BlackRock Ether Spot ETF named the “iShares Ethereum Trust.” Coinbase Custody Trust Company will serve as the ETF’s custodian, with CME CF Ether-Dollar as the chosen reference rate. This application follows BlackRock’s submission against the iShares Ether-Dollar Trust Entity the previous day.
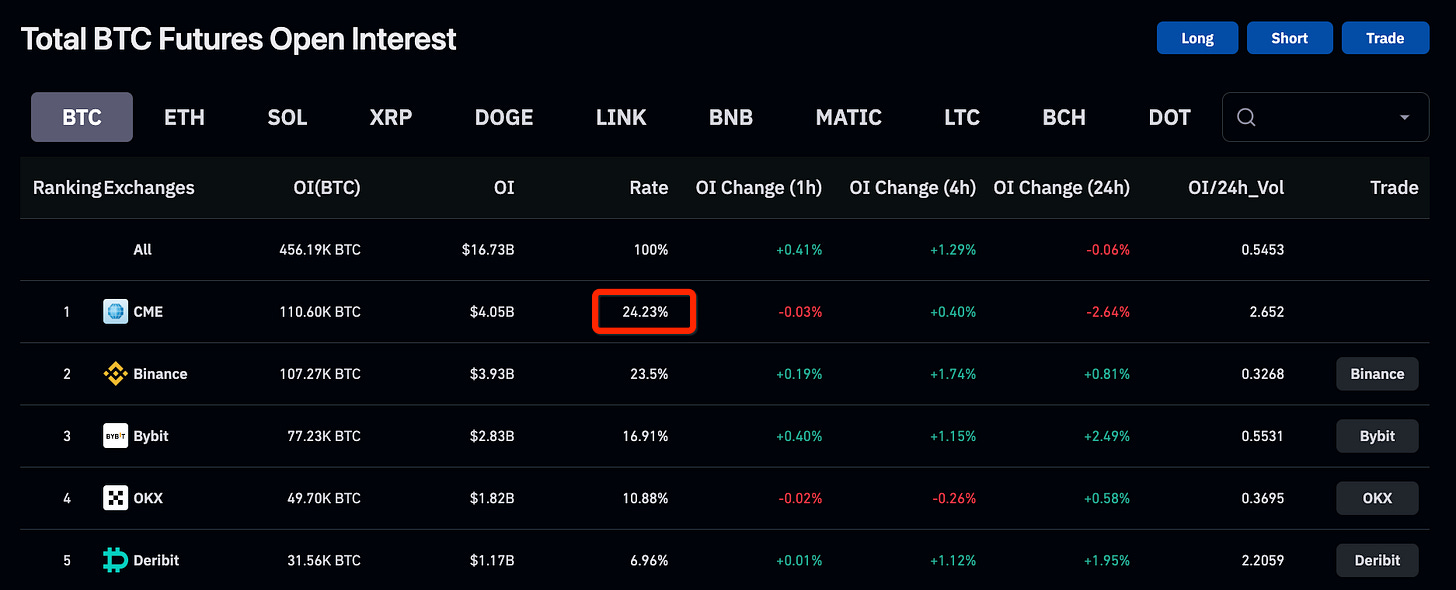
- CME Overtakes Coin as the Exchange with the Largest Position in BTC Futures Contracts
In a significant development for the cryptocurrency industry, CME has overtaken Coin, officially becoming the largest exchange in BTC futures contracts. This marks the first time CME has surpassed Coin in terms of BTC futures contract positions.

Technical Analysis
Bitcoin
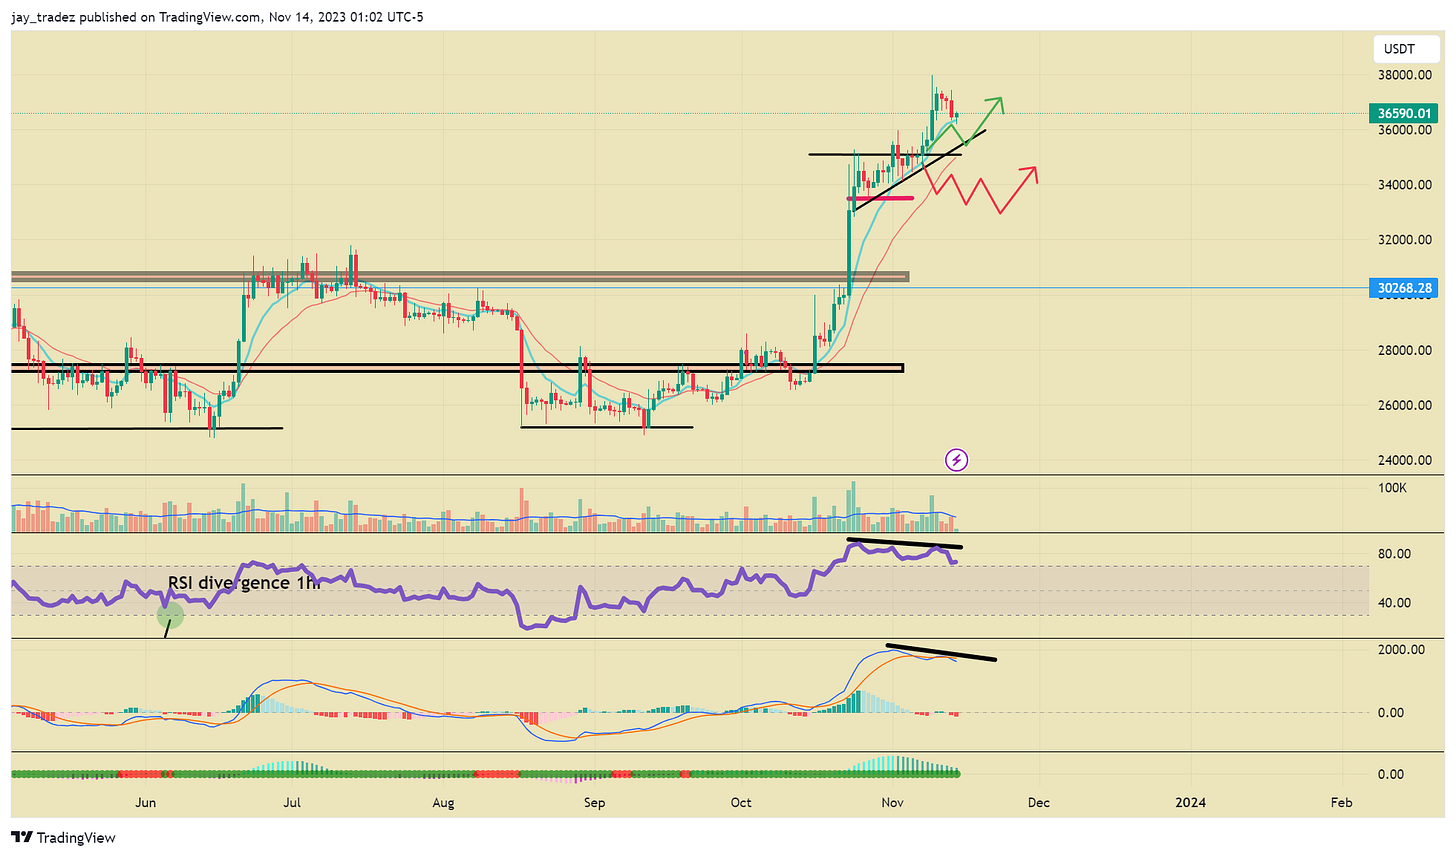
Last week, we said Bitcoin was in a bull pennant/bull flag pattern and would likely break out and move higher. This played out to, according to plan, reach a high of just around $38,000 before having a pullback. We are still looking for $40,000 as the target because historically, whenever Bitcoin broke back into its previous bull market range, it tends to move quickly into the middle of that range.
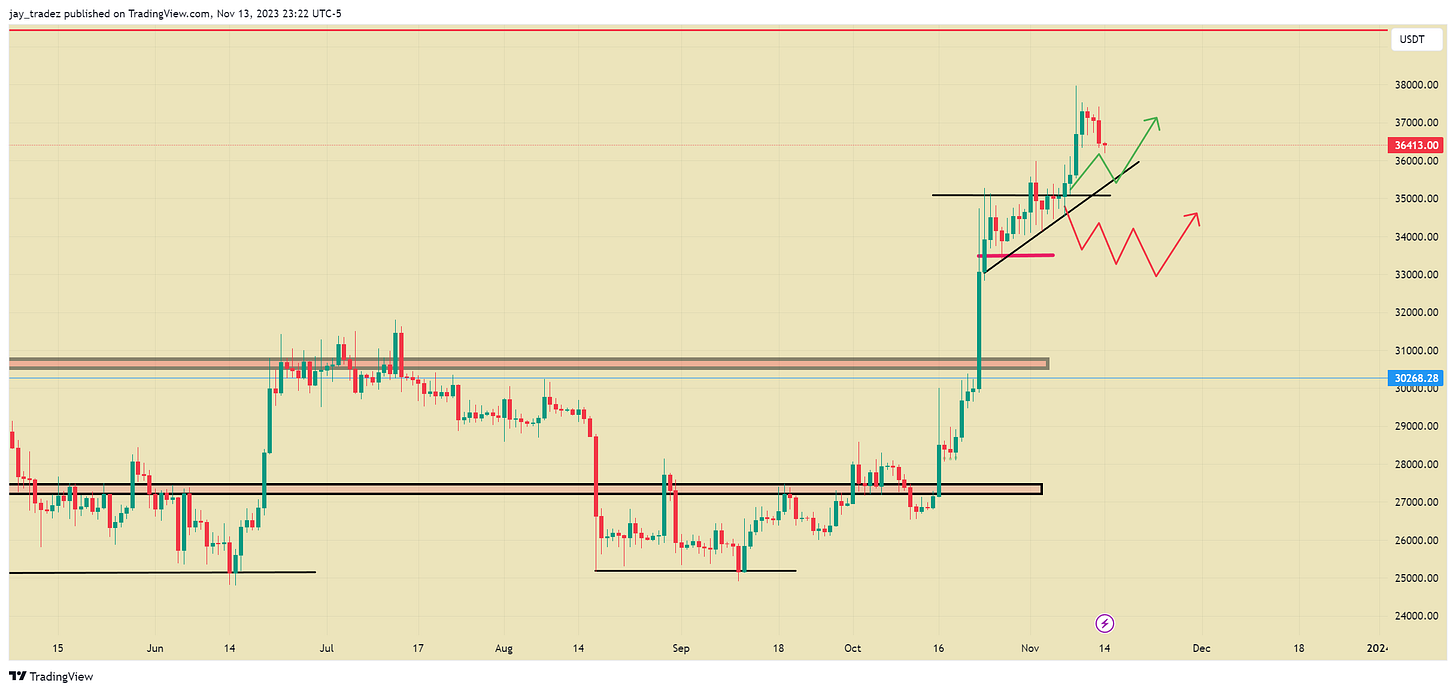

Currently, Bitcoin is retracing to the 9 EMA (blue line on the chart), which has acted as short-term support in the past 3 weeks. The EMA puts more weight on the recent price action, so it is a quick repricing price average and has proven to be the first level of support in bull trends, followed by the 21 EMA. Bitcoin will likely move higher and ride the 9 EMA higher as the bulls are still in control.
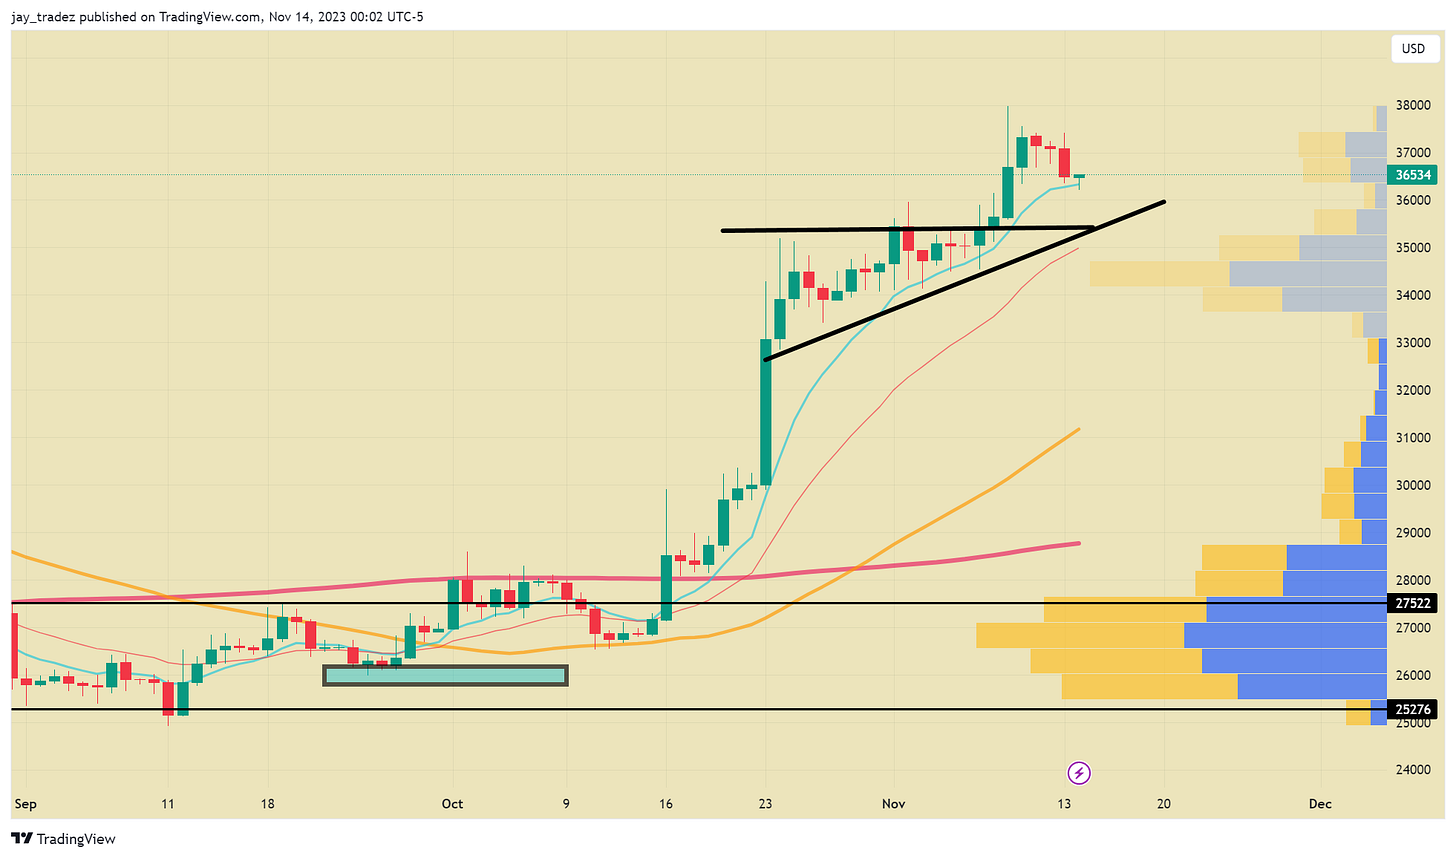

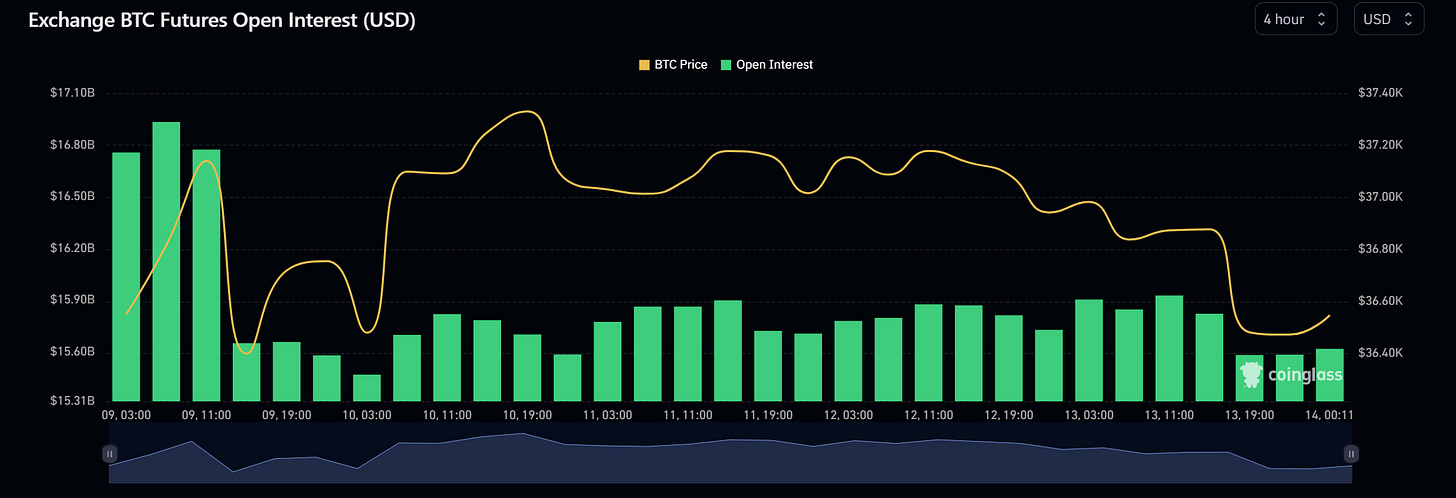
However, be very careful as we have been grinding higher for pretty long, and at these levels, there could be cascading liquidations, especially with the increase in future open interest. Below, we can see the quick drop in Bitcoin, even though quite small compared to others we have seen, still caused a drop of 1 Billion in open interest.

On top of that, we are seeing a divergence in both the RSI and the MACD on the daily chart. This is a very bearish sign, and unless we are in a full-blown bull market like in 2020 – 2021, this will usually play out to the downside. Even though this has been a bearish sign in the past, this has resulted in usually shallow pullbacks, so this does not mean the end of the bull trend. So keep this in mind as you are in your long positions.

Ethereum
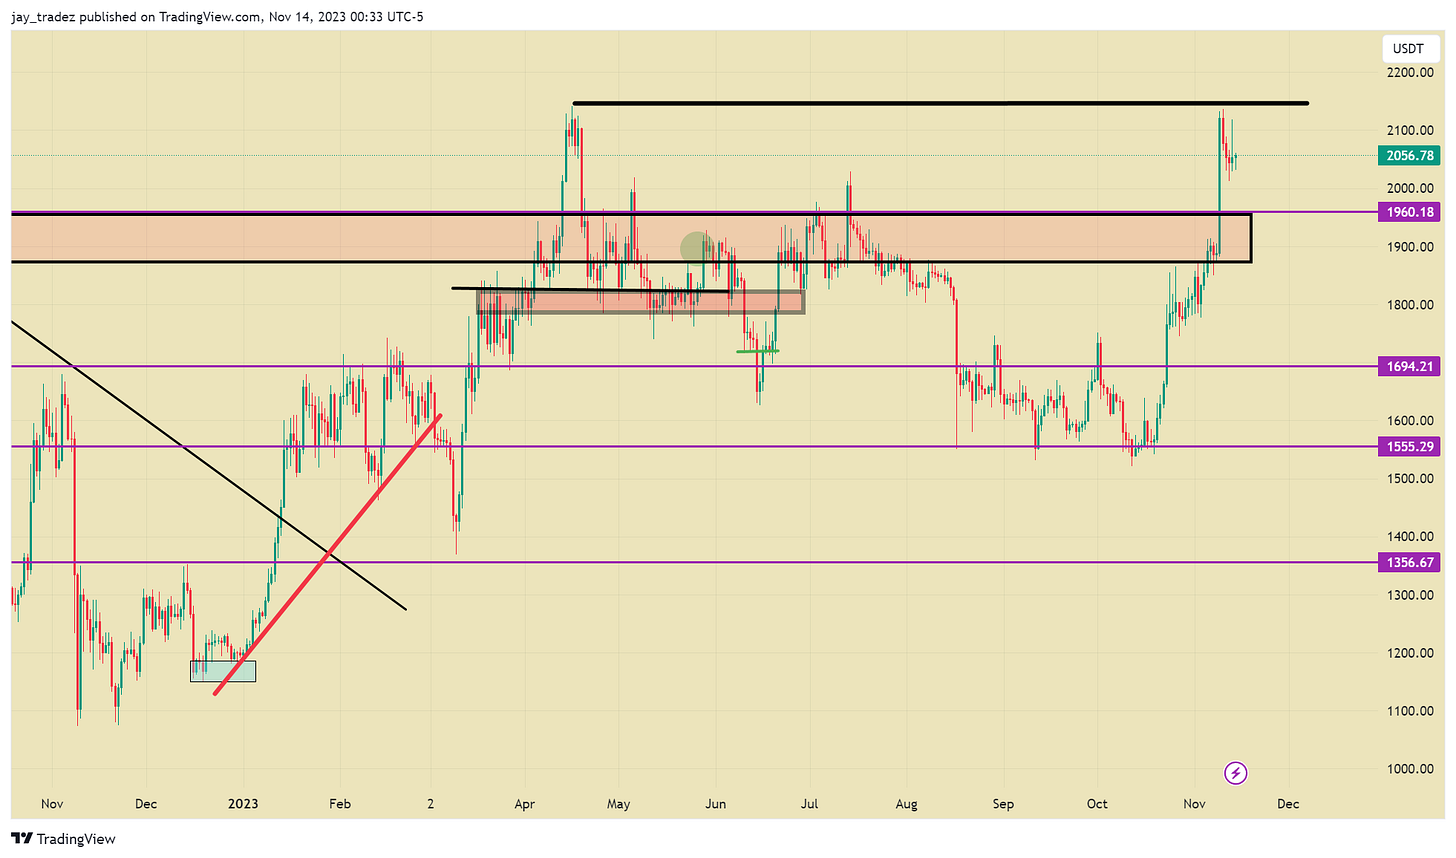
Ethereum has finally gotten some momentum behind it and is performing with relative strength compared to Bitcoin. This is due to Blackrock saying they will file for a spot Ethereum ETF. With this catalyst, we can see Ethereum playing catch up, which also likely added flames to the altcoins market, as we mentioned last week for readers to watch out for.


It is a very simple setup on ETH, as it is finally above the chop zone of $1,900 – $1,960. ETH will look bullish as long as we stay above this area, and dips should be bought. The key level of resistance for it to break above is $2,150, which is the 2023 high. If we can break and hold above this level, it’s clear skies above for ETH until around $2,500.

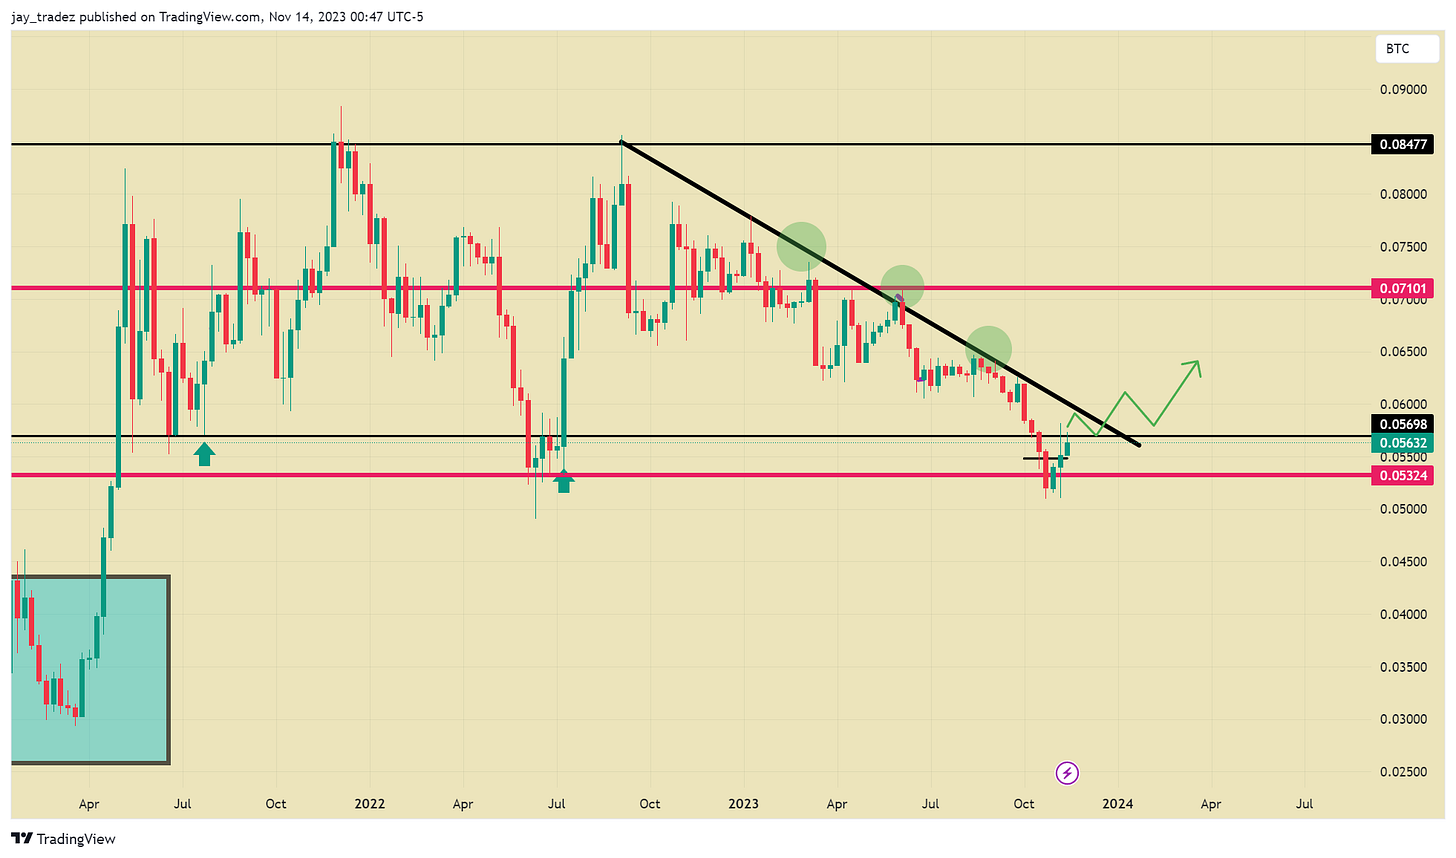
Looking at the ETH/BTC chart, we can see that it is trying to put in a bottom and reverse the downtrend that it has been in since August of 2022. For this to fully reverse the trend, we want to see a reclaim above 0.057, what we consider to be the bottom support, and then 0.059, which marks the downtrend line that has been acting as resistance for the past year. If ETH can do these two things, we could see a period of outperformance actualize. We would recommend trading this using either futures, flying-wheel bot, or grid bot.

Trading Recommendations
Bitcoin
Futures | Spot
Our short-term trade strategy outlined last week hit its entry point when, on the daily, it closed above $35,500. The first target of $37,00 was hit quickly, and we actually went to a high of $38,000, marking a $2,500 gain. Bitcoin is currently pulling back to the 9 EMA, as we discussed in the Technical section, and we expect it to bounce off the EMA. However, one thing to be careful of is the RSI and MACD divergence on the daily. As we said above, this could result in a drop, so just keep that in mind if you plan on holding for the $40,000 target.

Structured Product
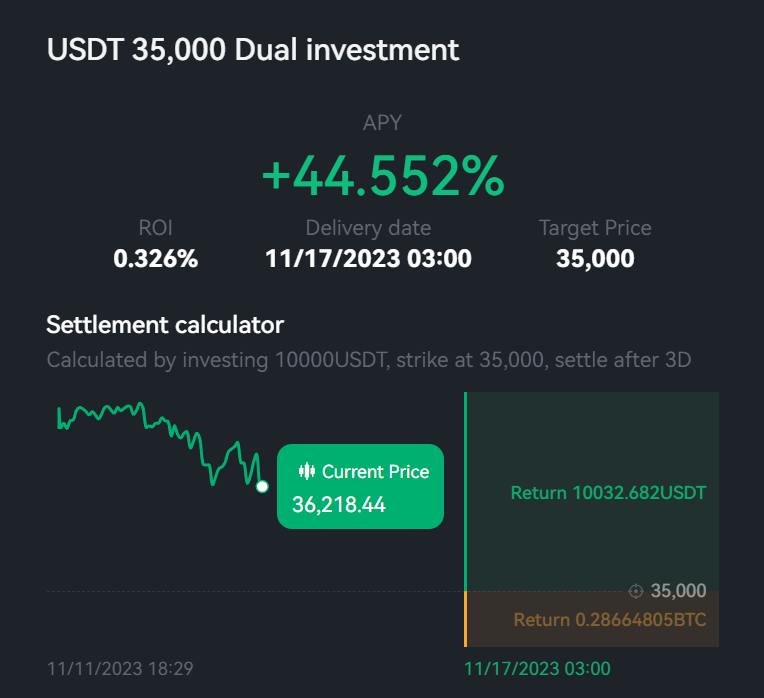
Last week, we suggested $32,000 buy-the-dip again, which is deep in profit as we are extremely far away from the strike level now. This week, we suggest a very aggressive strike with a high yield. We suggest a $35,000 Buy-The-Dip with a 3-day duration and 45% APY. $35,000 is the recent resistance we broke out from and intersects with the trendline. We believe this will be a good level of support this week.

Macro Analysis
U.S. Markets Experience a Terrifying Day as Stocks and Bonds Slump
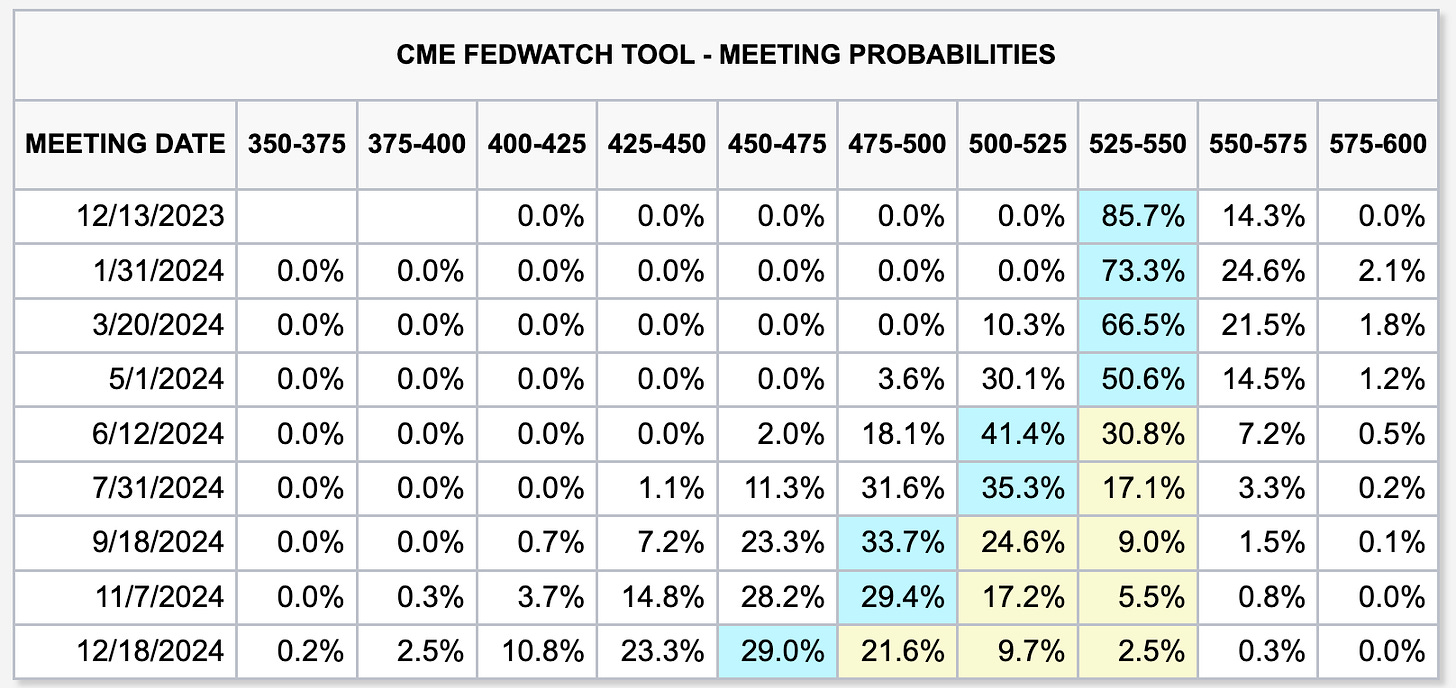
On November 9, the auction of 30-year U.S. Treasurys saw its worst performance in history, earning descriptions from Wall Street analysts as “bad” and “ugly.” The impact of the 30-year bond auction reverberated through the market, causing a downturn in both stocks and bonds, while the U.S. dollar resumed its upward trajectory. On the same day, Fed Chairman Jerome Powell tempered expectations of an imminent peak in interest rates, affirming his readiness to raise rates if deemed necessary. According to JPMorgan Chase & Co’s FedWatch tool, Thursday’s U.S. interest rate futures have priced in a 70% chance of a rate cut at the June meeting.
As the influence of macro factors on the currency market wanes, we are gradually redirecting our focus towards fundamentals and news updates.

Fundamental analysis
Fundamentals are out of the cooldown phase
For the DeFi platform to sustain itself, users must deposit funds into the trading pool in the form of loan collateral or liquidity. As the Total Value Locked (TVL) of the DeFi platform increases, key fundamentals like liquidity, popularity, and accessibility all experience positive growth. A higher TVL signifies more capital locked in the DeFi agreement, allowing participants to enjoy enhanced benefits and returns. The wealth effect, in turn, attracts more capital into the trading pool, further elevating the platform’s TVL and creating a positive “flywheel effect.”
As per the latest data from DefiLlama, the TVL of the entire network has surged to USD 46.9 billion, marking a departure from the trough and returning to the levels seen during the bull market in June. This indicates that recent market dynamics have had a substantial stimulating effect on the fundamentals. We believe that the gradual improvement of the platform’s fundamentals will provide a significant boost to the DeFi market. If subsequent TVL data confirms the ongoing improvement in market fundamentals, the bull market is likely to persist in a more robust and enduring manner.


The market is betting on the ETF to pass as expected
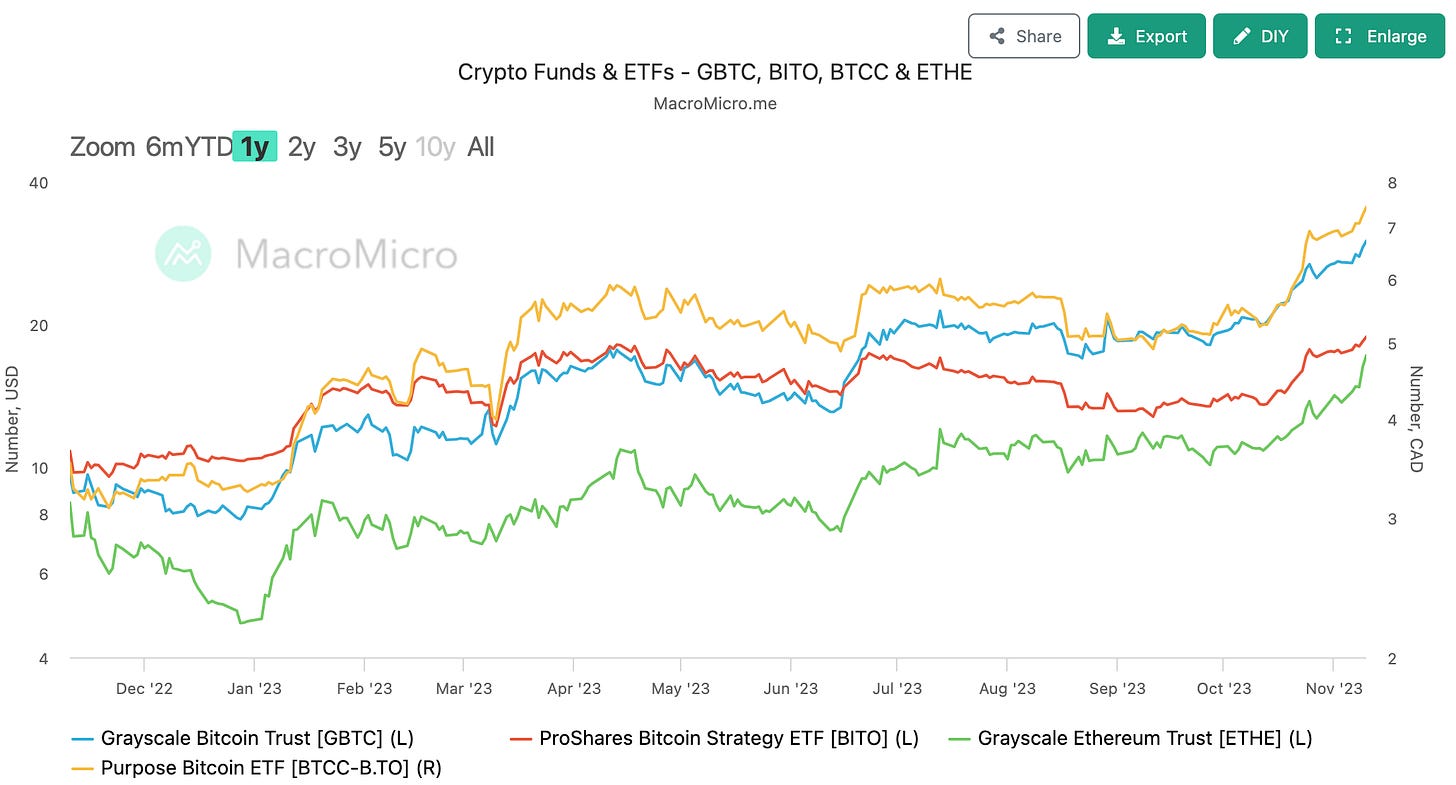


As per “financial M square” data, the current market representative funds, including the Gray BTC Trust Fund (GBTC), have experienced substantial gains. The negative premium of GBTC continues to climb and has returned to the levels observed in the third quarter of 2021. The upward trend in negative premiums signals heightened market confidence in the long-term potential of the blockchain sector. Given this scenario, we posit that investing in GBTC is the wiser choice, offering a more lucrative dual return than investing solely in BTC spot. This dual return includes dividends from the reversion of the negative premium to a positive one and capital gains arising from the increase in the spot BTC currency price itself.
Retail Inflows, Large Outflows
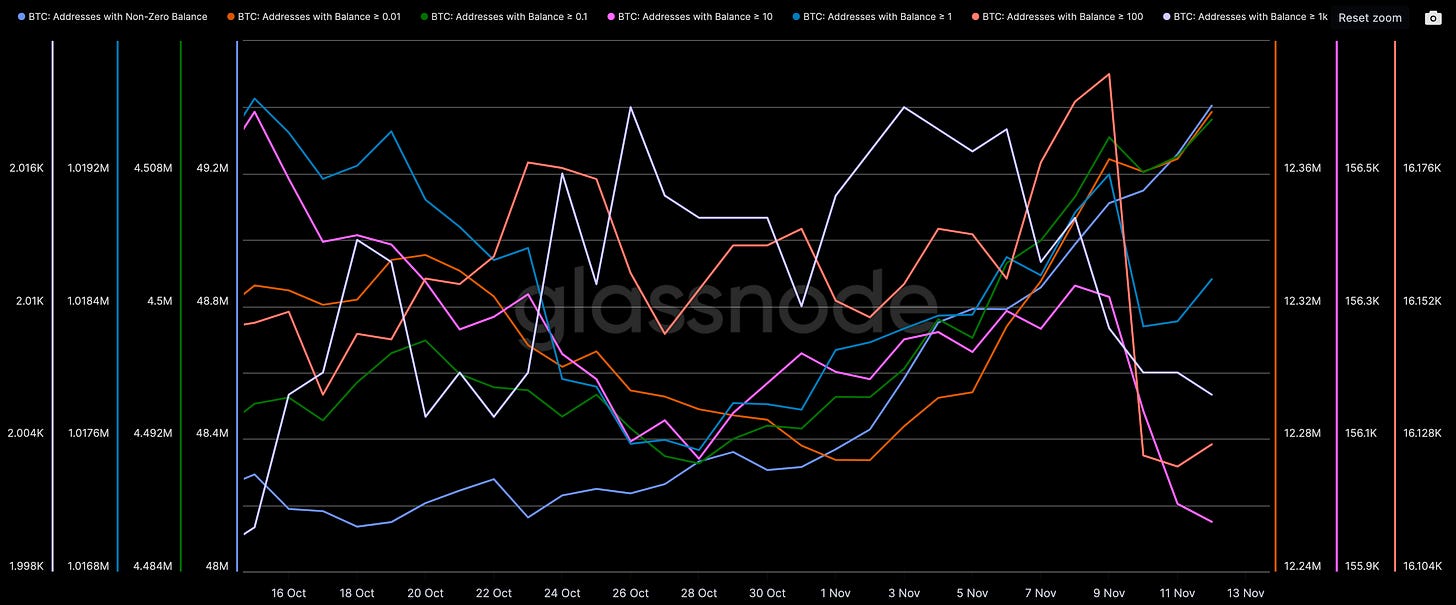

Based on Glassnode’s recent one-month analysis of chained Bitcoin holding address changes, the overall active addresses exhibit a consistent growth trend. However, a closer examination reveals distinct data differentiations. Notably, the number of addresses holding more than 1,000 Bitcoins has dwindled from its 2019 peak to 2006. There was a sharp decrease in the number of addresses holding over 100 Bitcoins, dropping from the November 9 peak of 16,194 to 16,125 on November 10 within a single day. Similarly, addresses with more than 10 Bitcoins decreased from 156,331 to 155,975.
Although the number of addresses holding more than 1 Bitcoin saw a decline from 1,019,196 to 1,018,278, there has been a continuous increase in addresses holding 0.01 and 0.1 or more Bitcoins.
The chain data alterations clearly indicate an overall rise in new addresses, concurrent with a reduction in the number of large Bitcoin holders (closing out positions) and an increase in retail addresses (attributed to FOMO-driven buying rallies).
