Weekly Crypto Market Research and Trade Ideas 9/12 – 9/19
Contents
Summary:
- If Bitcoin reclaims $27,500, we would change our outlook from sideways consolidation to cautiously bullish.
- $25,000 has proven to be a solid level of support in the short term and we gave our cautious optimistic outlook last week.
- FOMC decision expected to keep rates at the same level.
- Watch out for the new dot plot as it will give insights into what is about to come. We believe Powell gives the message of higher for longer as headline CPI rebounds with Oil prices.
- Bitcoin outperforming all other coins as investors are cautious and rotating into value.
- We believe that Bitcoin’s market share will continue to rise in the near future.
- Due to mixed market sentiment, we are leaning towards a continued sideways market.
Trading Recommendations
Bitcoin
Futures | Spot
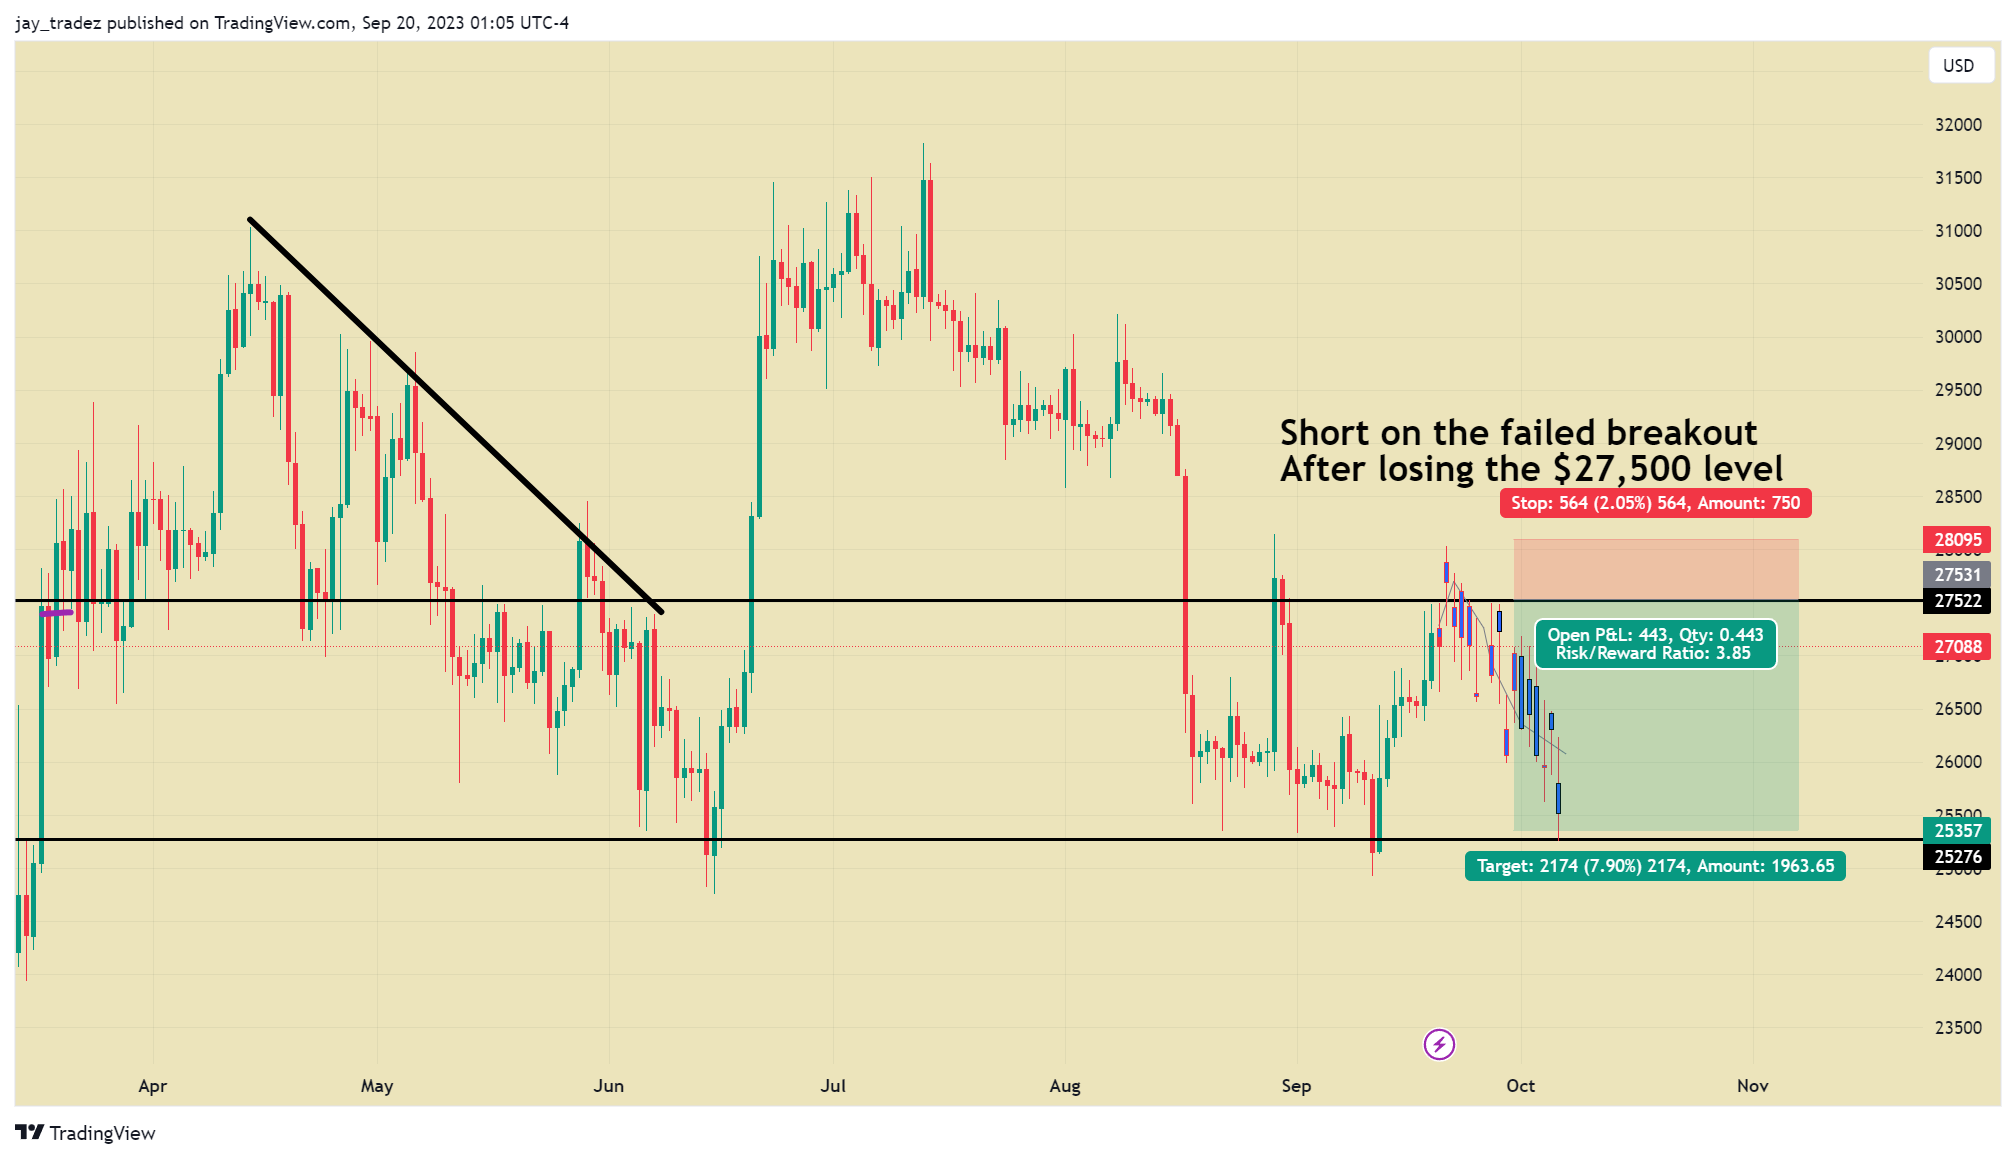
The idea is on the chart. We could see a short trade if we get a failed breakout of the $27,500 level. A failed breakout is a breakout that does not hold over its breakout level, so in this case a move under $27,500 would be the short entry. This trade has limited risk and an almost 4:1 Risk Reward ratio. Recommended stops at above $28,000 and a target of around $25,000.
Structured Product
Given our perspective, which indicates that $28,000 will likely serve as a resistance level, we advise scaling back your Bitcoin holdings near this price point to manage risk. If you intend to hold onto your Bitcoins, we suggest a longer-term covered gain strategy with a strike price of $29,000. Currently, Implied Vol is higher due to the FOMC decision tomorrow afternoon. We recommend locking in the high-interest returns as this will likely be a none-event, causing Vol to die down afterward. This strategy provides a well-rounded combination of high-interest returns and the chance to lock in profits if you bought in on the current dip.
Please refer to the details of the two orders below, which include information about the duration, interest return, and strike price.


Macro Analysis
FOMC
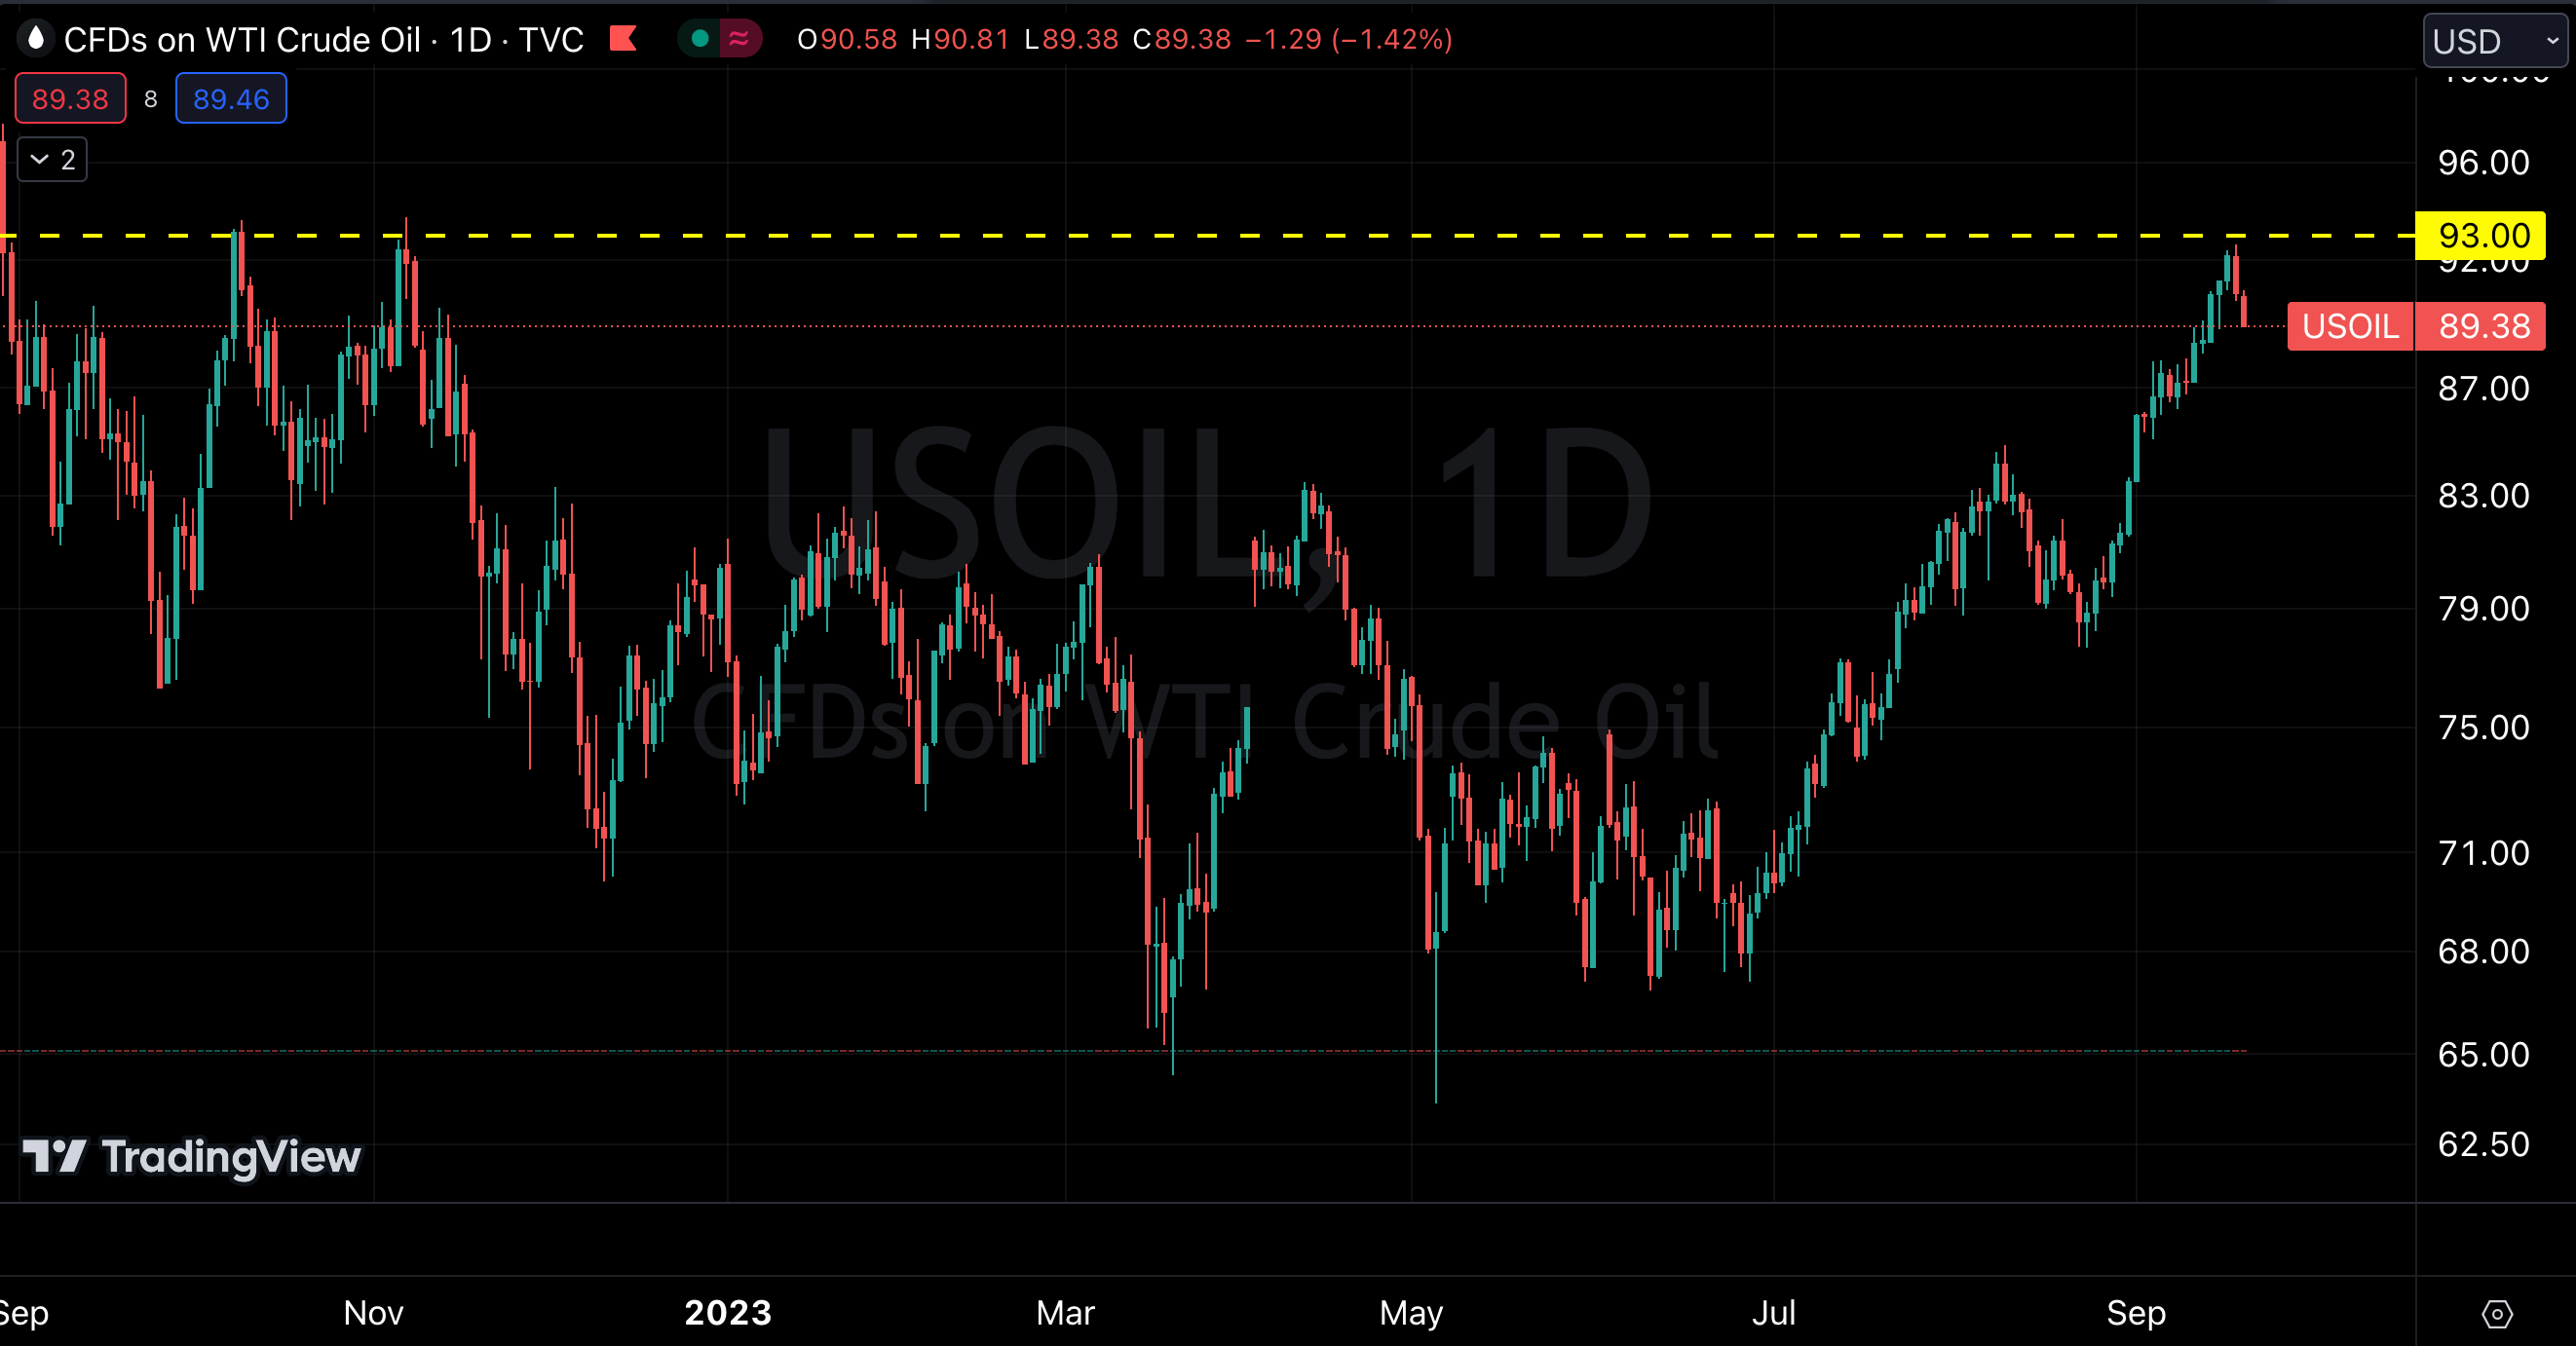
With the likely decision to keep rates higher for longer but not hiking or having 1 more hike max, we believe it will keep volatility low in the equities market and have little effect on the Crypto market this time around. The new dot plot will give insights into what is about to come. We believe Powell gives the message of higher for longer as headline CPI rebounds with Oil prices.

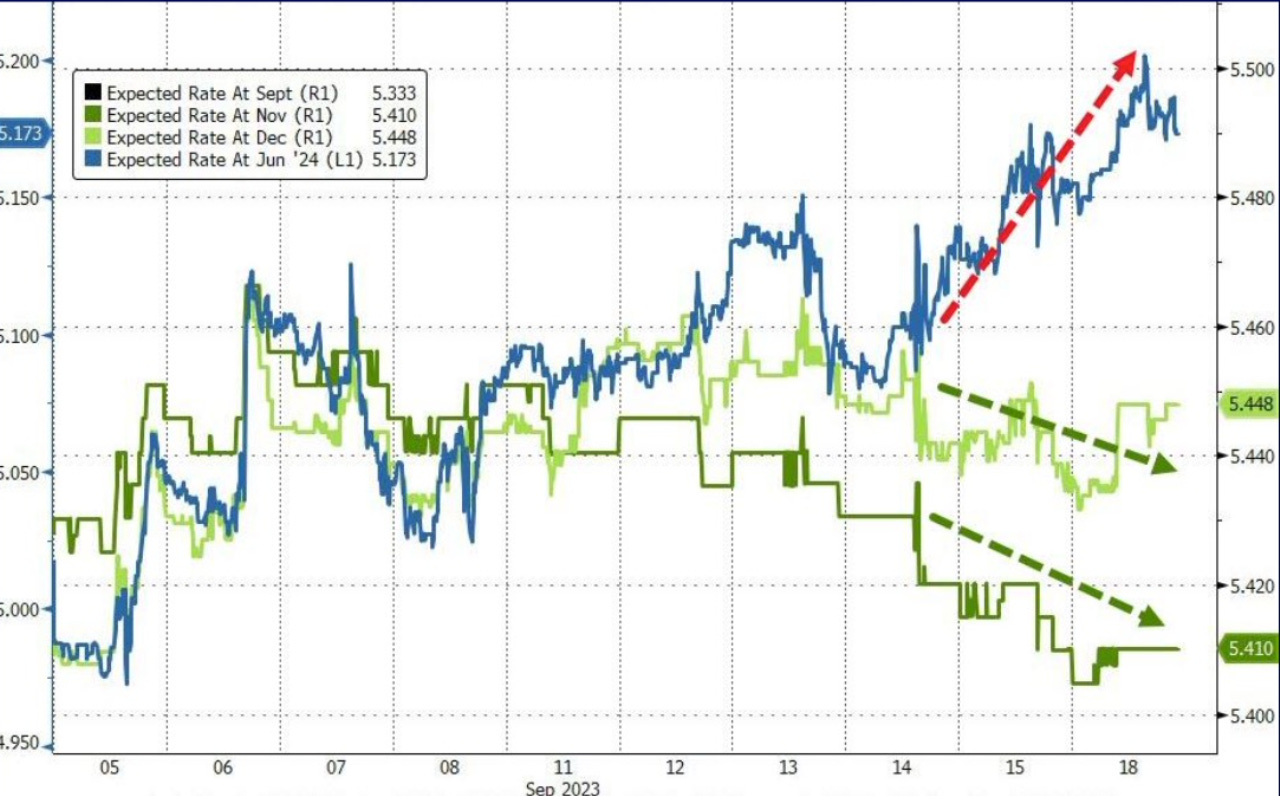
We believe that the macroeconomic factors are still quite evident. This week, the market is once again anticipating the Federal Reserve interest rate meeting, and the market has clearly made its own judgment. Recently, we have observed significant changes in market interest rate pricing. This change is mainly reflected in two aspects: on the one hand, the market widely believes that there will be no further interest rate hikes this year, which is in line with expectations. However, what has changed is the expectation for rate cuts next year, with the market generally expecting a reduction in the number of rate cuts next year. This trend may be due to the unexpected resilience in the U.S. economy, as well as the sticky inflation pressures. Recent energy prices continue to surge, and some institutions predict that oil prices could rise to $100 by year-end, putting significant pressure on prices. Market participants may believe that this is not a one-off situation; the Federal Reserve would then reduce the number of rate cuts so as not to have a resurgence in inflation.
However, this change does not necessarily represent a fixed trend in future interest rate movements. In fact, due to the uncertainty of global macroeconomic factors, such as expected changes in regulatory policies and the macroeconomic environment, there is still a certain degree of variability for cryptocurrencies. Due to the mixed sentiment in the current market, factors such as the upcoming Bitcoin halving, Bitcoin spot ETF, and the Federal Reserve’s reluctance to exit its tightening policy all make both headwinds and tailwinds very apparent. Therefore, we are more inclined towards a sideways trading market. Of course, when considering potential market risks and opportunities in the future, investors need to take various factors into account.
Technical Analysis
BTC
Price action has perfectly mimicked the predicted pattern that we shared over a month ago after the Grayscale win against the SEC in court. It appears that our forecast of a sideways consolidation has been accurate. If our analysis continues to hold true, the $28,000 resistance level should remain intact as the upper boundary of this range.
Specifically, we identify the precise resistance level to be within the range of $27,700 to $28,000, with a rounded-up figure of $28,000 to provide a margin of error. This level aligns with the 200-SMA (Red Line) at $27,700 and the 50-SMA (Orange Line) at the current price of $27,300, serving as potential selling points in the market.


We recommend selling at either the $28,000 resistance level or at nearby market prices. The recent bounce and the subsequent failure to break below the $25,000 support indicate that, in the short term, this level should function as the lower boundary of the trading range. Our assessment suggests that Bitcoin didn’t experience a breakdown primarily because the selling pressure was predominantly concentrated in the broader altcoin market. Some of the capital flowing out of altcoins found its way into Bitcoin as a safety asset, providing support for the ongoing rally. As evident in the BTC-denominated pairs below, many major altcoins are breaching yearly lows, underscoring their relative weakness.
At this point, the technical aspects of the market become more complex. There is a web of resistance levels between $27,000 and $29,000, depending on one’s choice of levels and time frames. The higher time frames exhibit a bullish confluence above $29,000 (at the earliest $28,000), and they demonstrate a bearish confluence below $25,700, which would negate the failed breakdowns observed on the weekly and daily charts. In the absence of the breakout or breakdown scenarios, we anticipate consolidation between the two extremes, which in our view, is the most likely scenario. However, this could change with narrative shifts in the news cycle.


ETH
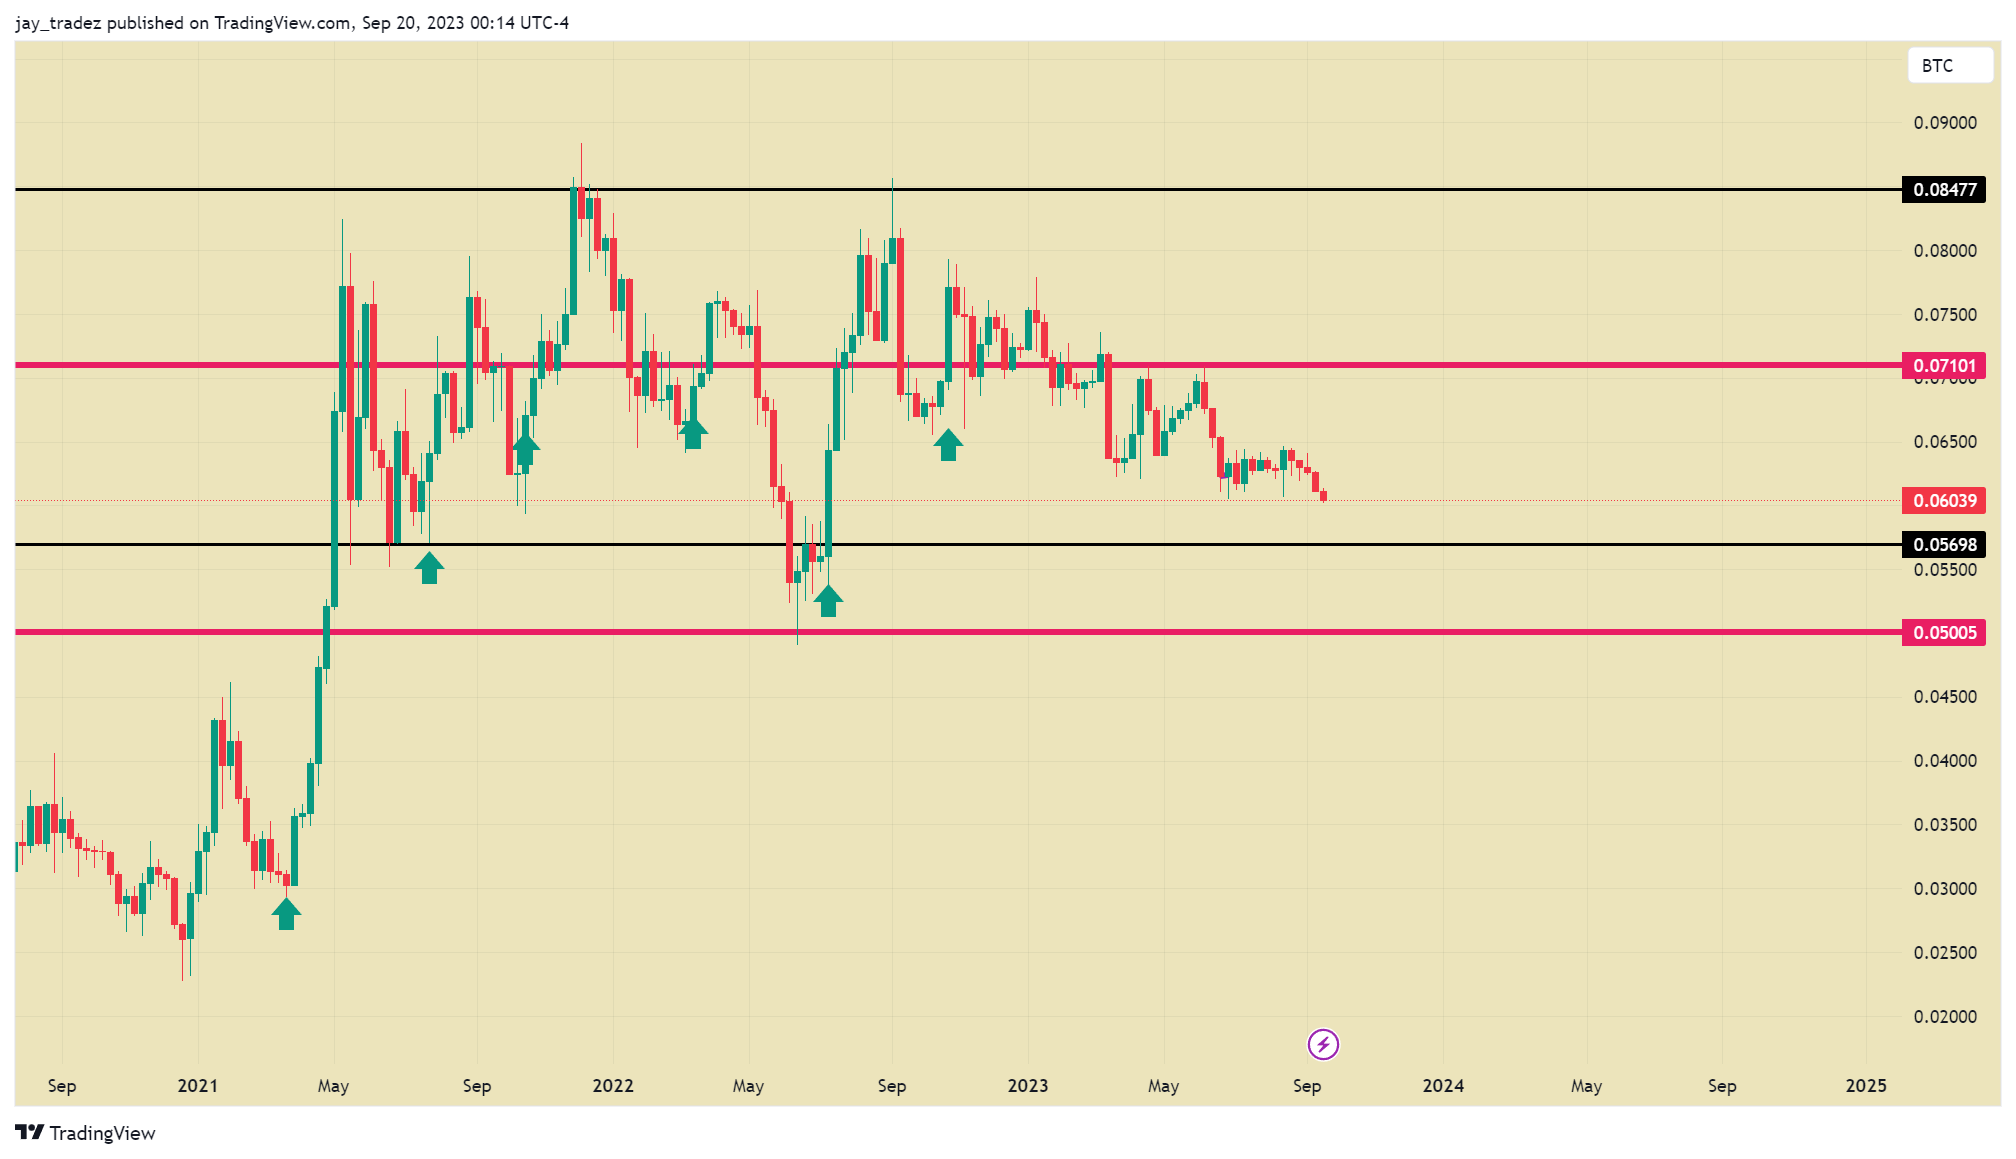
ETH continues to underperform BTC, as evident in the ETH/BTC chart. It is breaching yearly lows following another lower high on the weekly chart. The following support level for this pair is anticipated to be at 0.057. We anticipate this relative weakness to persist over the next 1 to 2 months.
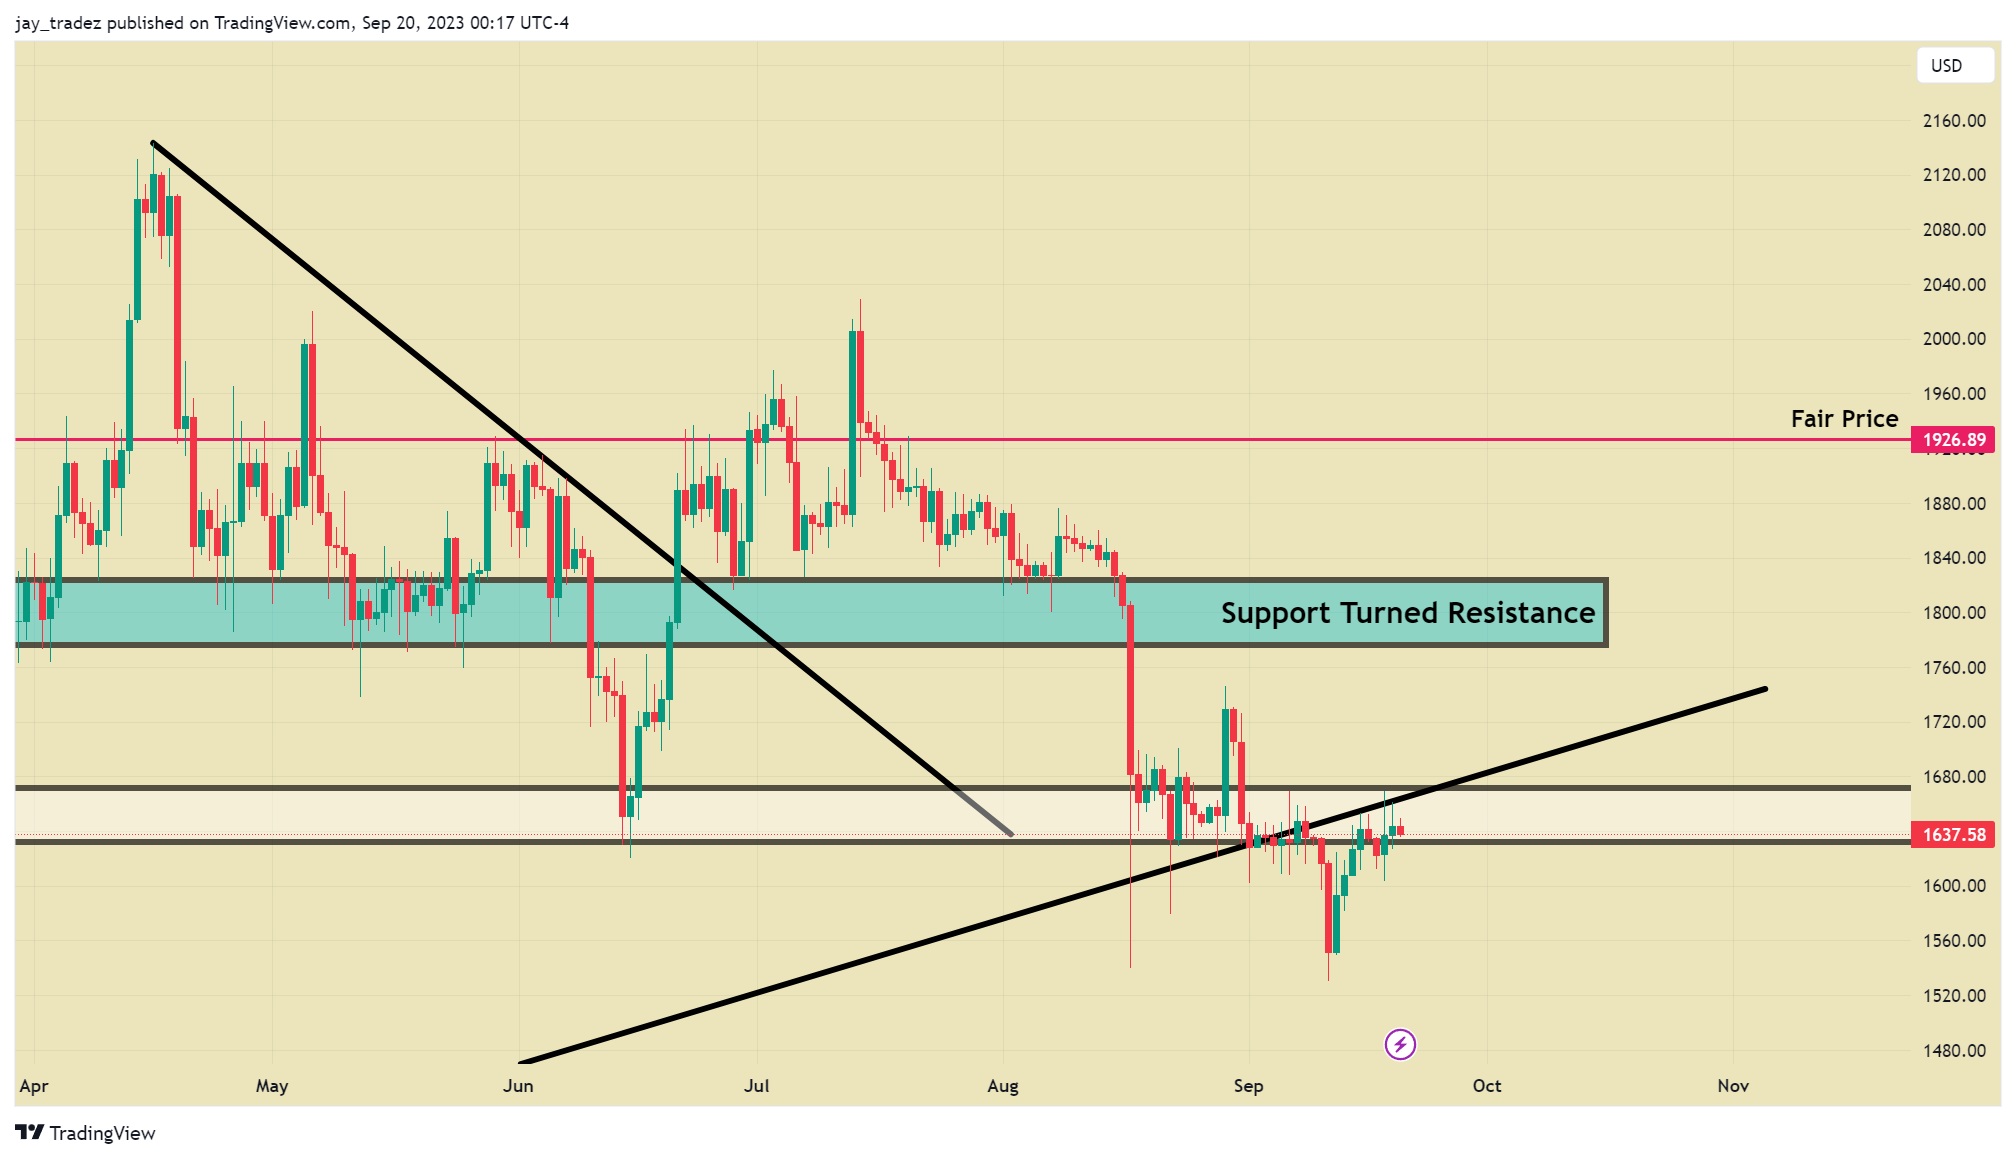
On the ETH/USD pair, there is a retest of the previous higher-lower level, which previously served as support but has now transformed into resistance after being broken. Notably, the USD pair trades below the $1700 range, encountering resistance in that zone. While ETH is underperforming now it is worth reiterating to readers that in more bullish market conditions, potentially in 2024, ETH has historically outperformed Bitcoin. This is also the base case for our strategy surrounding the ETH/BTC grid and Flying Wheel bot.
Currently, it is reasonable to use ETH as a proxy for altcoin risk appetite. Considering the absence of new inflows and the lack of non-Bitcoin narratives, the weakness in ETH’s price and that of large-cap altcoins indicates a market focus on Bitcoin risk. Given the current conditions, Ethereum does not seem to be the appropriate instrument for us to take on risk, as it does not align with a significant technical pivot level or narrative support. If you’re bullish, it seems likely that you’d be better off trading Bitcoin. If you’re bearish, it seems better to short weak altcoins.
Fundamental Analysis
Positive News on Liquidity
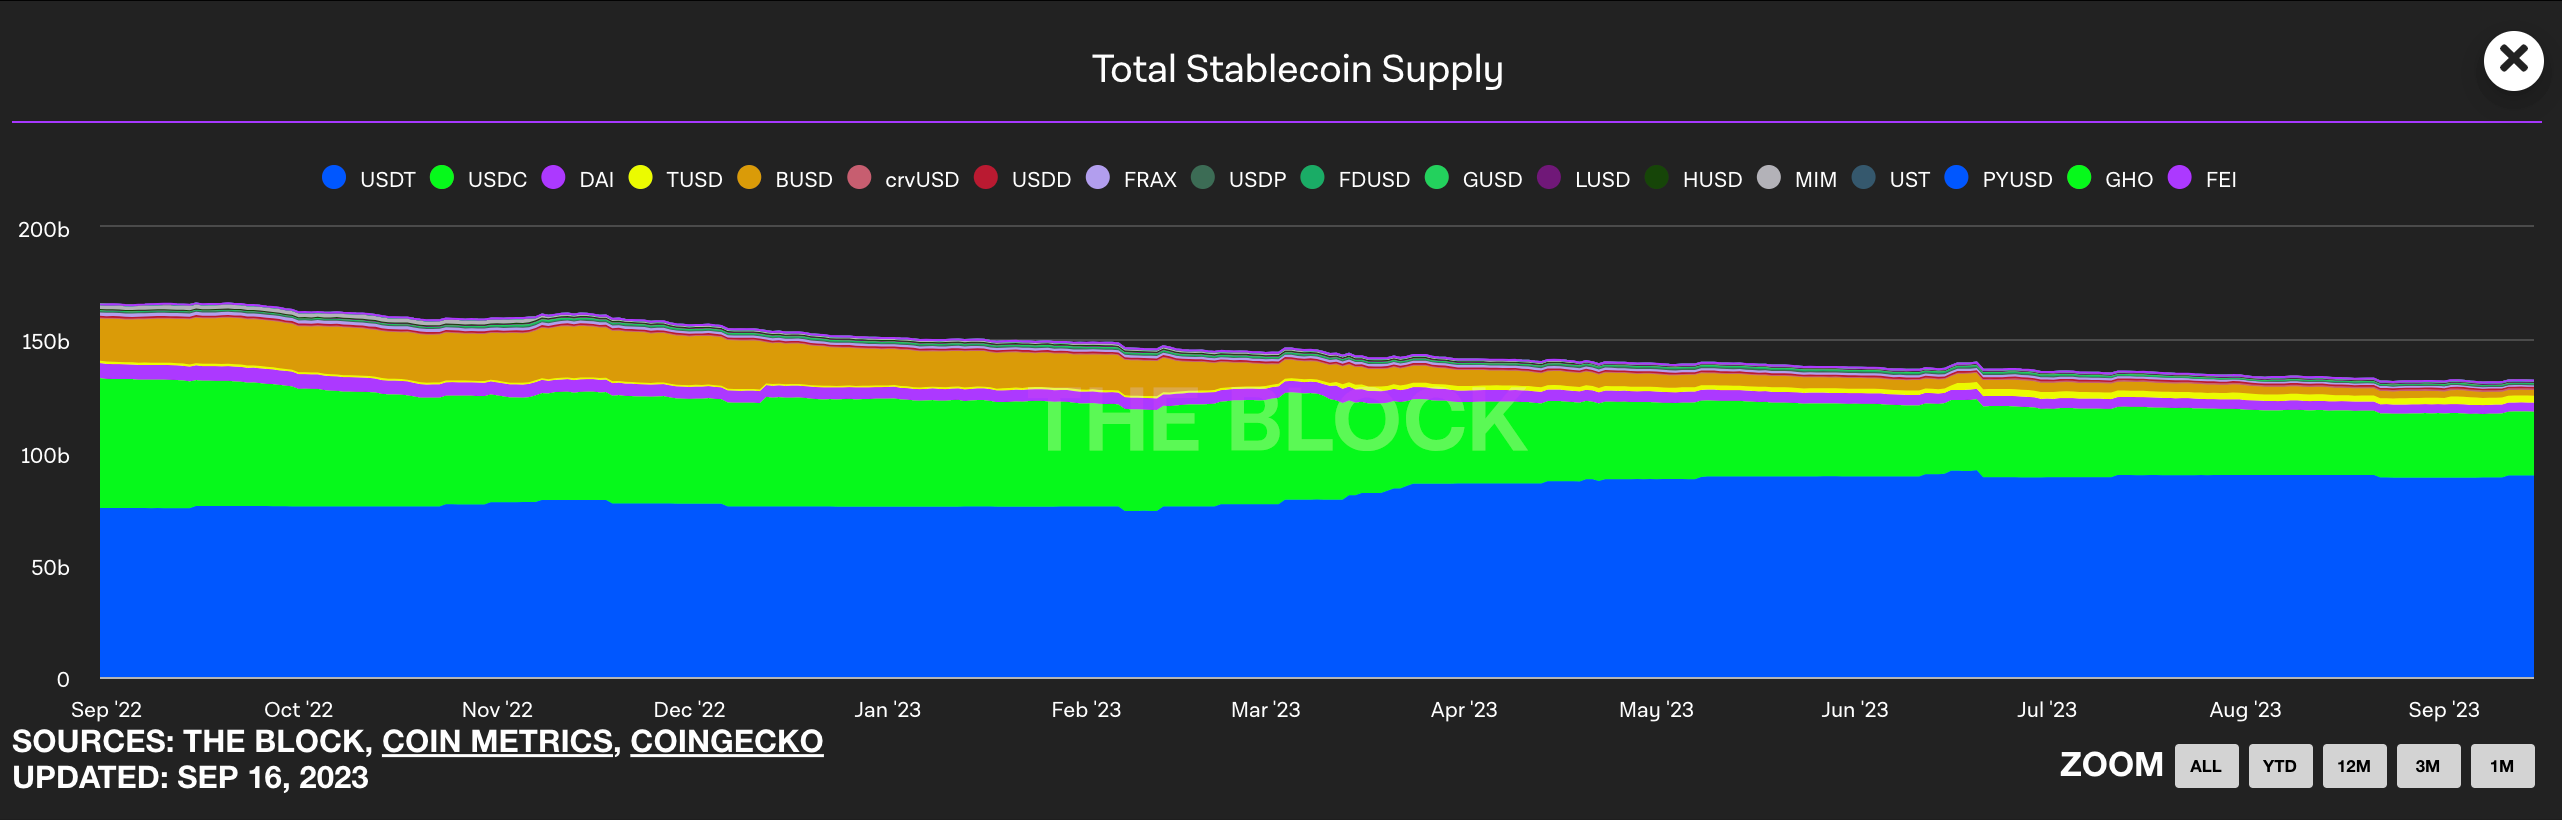
Over the past few months, the supply of stablecoins has shown a continuous decline, possibly due to investor concerns about the market conditions and worries about cryptocurrency volatility. However, now that stablecoin supply has bottomed out and started to rebound, we may be witnessing a new trend in the market. We believe that this may indicate an adjustment in the market’s expectations for recent cryptocurrency price volatility and a gradual acceptance of this environment as the new normal.
In any case, the strong performance of stablecoins provides a positive signal, suggesting that the market is recovering. Alongside the recent gradual rebound in the market, we expect liquidity to continue to improve and provide more fuel for market recovery.
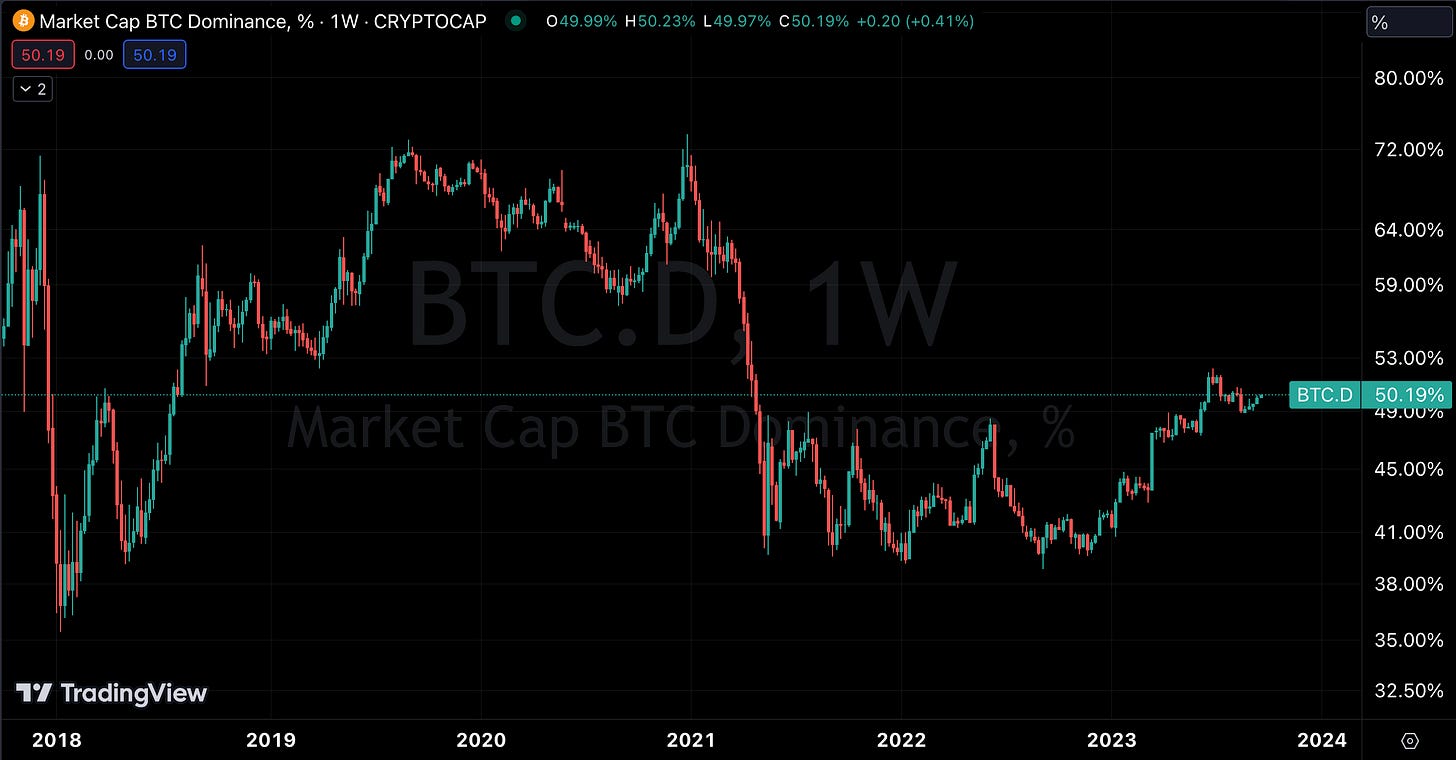
Continuous Increase in Bitcoin Market Dominance
Over the past few months, market favorability towards Bitcoin has remained stable, driven by positive news such as ETF developments. Investors have redirected their funds and attention back to Bitcoin, and currently, its market dominance has exceeded 50%. While Bitcoin’s market dominance has significantly increased over the past eight months, Ethereum’s market dominance has remained stable at around 20%. Currently, Bitcoin and Ethereum’s total market capitalization accounts for 70% of the overall cryptocurrency market capitalization. We believe that Bitcoin’s market share may continue to rise in the near future due to increasing regulatory pressure.